
C2 June 2018 Q1
1.
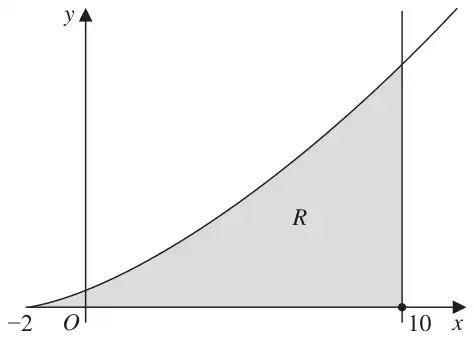
Figure 1 shows a sketch of part of the curve with equation\[y = \frac{(x + 2)^{\frac{3}{2}}}{4}, \qquad x \geqslant -2\]The finite region \(R\), shown shaded in Figure 1, is bounded by the curve, the \(x\)-axis and the line with equation \(x = 10\)
The table below shows corresponding values of \(x\) and \(y\) for \(y = \dfrac{(x + 2)^{\frac{3}{2}}}{4}\)
| \(x\) | \(-2\) | 2 | 6 | 10 |
|---|---|---|---|---|
| \(y\) | 0 | \(6\sqrt{3}\) |
| \(x\) | \(-2\) | 2 | 6 | 10 |
|---|---|---|---|---|
| \(y\) | 0 | 2 | \(\boldsymbol{4\sqrt{2}}\) | \(6\sqrt{3}\) |
| Scheme | Marks |
|---|---|
| \(\{\text{At } x = 2,\}\ y = 2\) and \(\{\text{At } x = 6,\}\ y = 4\sqrt{2}\) or \(2\sqrt{8}\) or awrt 5.7 | B1 cao |
| (1) |
Notes
B1: 2 and \(4\sqrt{2}\) or \(2\sqrt{8}\) or awrt 5.7 (or any correct unsimplified surd equivalent given as the final answer to part (a)) These may be stated as a final answer and not appear in the table, or may appear in the table. If a correct surd appears in the working (unsimplified) and is then simplified to give an incorrect answer to (a) which is used in the table and in part (b) then this is B0.
| Scheme | Marks |
|---|---|
| \(\dfrac{1}{2} \times 4\) ; or \(h = 4\) | B1 oe |
| \(\underline{\left\{0 + 6\sqrt{3} + 2\left(\textit{their } 2 + \textit{their } 4\sqrt{2}\right)\right\}}\) For structure of \(\{\ldots\ldots\ldots\ldots\}\) | M1A1ft |
| \(\tfrac{1}{2} \times 4\,\underline{\left\{0 + 6\sqrt{3} + 2\left(2 + 4\sqrt{2}\right)\right\}}\ \{= 2(25.706) = 51.412..\} =\) awrt 51.412 | A1 |
| (4) | |
| (5 marks) |
Notes
B1: for using \(\tfrac{1}{2} \times 4\) or 2 or equivalent or for stating \(h\)
M1: requires the correct \(\{\ldots\ldots\}\) bracket structure.
It needs the first bracket to contain first \(y\) value (as this is zero it may be omitted) plus last \(y\) value and the second bracket to be multiplied by 2 and to be the summation of the remaining \(y\) values in the table with no additional values. If the only mistake is a copying error or is to omit one value from 2nd bracket this may be regarded as a slip and the M mark can be allowed ( An extra repeated term forfeits the M mark however). M0 if values used in brackets are \(x\) values instead of \(y\) values
A1ft: for the correct bracket \(\{\ldots\ldots\}\) following through candidate’s \(y\) values found in part (a).
A1: for answer which rounds to 51.412 then isw
NB: Separate trapezia may be used : B1 for 4, M1 for \(\dfrac{1}{2}h(a + b)\) used 3 times (and A1ft if it is all correct )
Then A1 as before.
Special case: Bracketing mistake \(2 \times (0 + 6\sqrt{3}) + 2\left(2 + 4\sqrt{2}\right)\) scores B1 M1 A0 A0 unless the final answer implies that the calculation has been done correctly (then full marks can be given). An answer of 36.098 usually indicates this error.