
Higher November 2022 Paper 4 Q21
21 60 people each try to solve a puzzle.
The table summarises their recorded times.
| Recorded time (t minutes) | Frequency |
|---|---|
| \(0 \lt t \leqslant 5\) | 12 |
| \(5 \lt t \leqslant 15\) | 19 |
| \(15 \lt t \leqslant 30\) | 18 |
| \(30 \lt t \leqslant 50\) | 11 |
(a) Draw a histogram to show this information.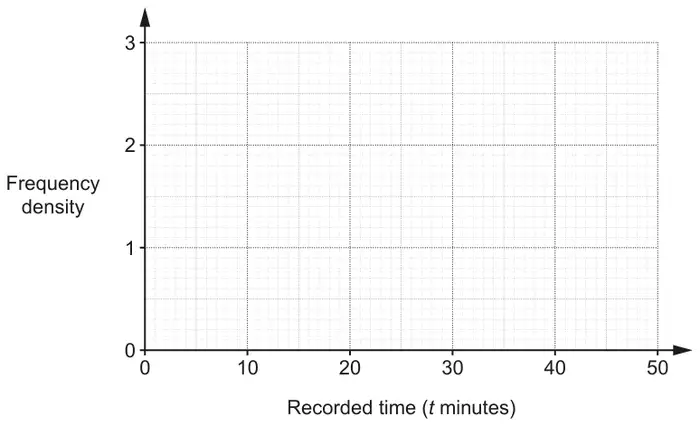
(b) Those people who failed to solve the puzzle within 50 minutes were given a recorded time of 50 minutes.
Nina uses mid-interval values to estimate the mean recorded time of the 60 people.
Explain why Nina’s answer is likely to be an under-estimate for the mean of the actual time taken by the 60 people. [1]
| Answer | Marks | Part marks and guidance | |
|---|---|---|---|
| correct histogram with four bars with frequency densities 2.4, 1.9, 1.2, [0].55 and correct width bars | 3 | B2 for two correct bar heights or B1 for one correct bar height or two correct frequency densities from 2.4, 1.9, 1.2, [0].55 soi | bar heights should be accurate, condone for height 0.5 ≤ bar 0.55 ≤ 0.6 tolerance for plotting and drawing the bars is ± \(\frac{1}{2}\) small square |
| Answer | Marks | Part marks and guidance | |
|---|---|---|---|
| e.g. the mean should be higher because these people would have taken longer than 50 minutes | 1 | ||
Appendix: exemplar responses for Q21(b)
| Response | Mark |
|---|---|
| the mean should be higher because these people would have taken longer than 50 minutes | 1 |
| the recorded time is less than the actual time | 1 |
| they might have taken a lot longer | 1(BOD) |
| actual time [for some people] is over 50 minutes | 1 |
| there are some people more than 50 who are counted as 50 | 1(BOD) |
| she used the mid-interval values | 0 |
| results are not uniformly distributed within each group | 0 |
| she did not use all the results | 0 |