
Higher June 2023 Paper 4 Q19
19 The graph shows the velocity of a particle over the first 20 minutes of its motion.
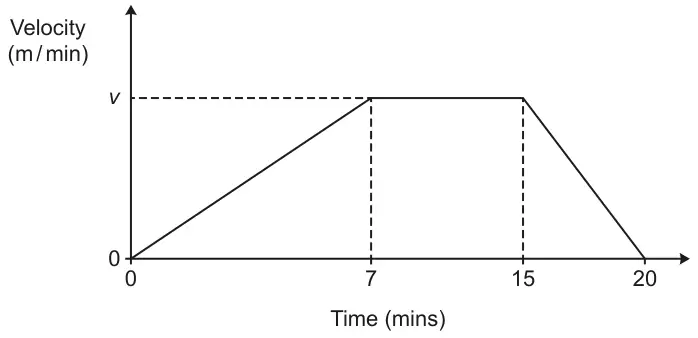
Not to scale
Between 7 minutes and 15 minutes the velocity of the particle is \(v\) metres per minute.
The average velocity of the particle over the 20 minutes is 11.55 metres per minute.
Find the value of \(v\).
You must show your working. [5]
| Answer | Marks | Part marks and guidance | |
|---|---|---|---|
| 16.5 with correct working | 5 | M1 for 11.55 × 20 implied by 231 AND M2 for \(\frac{1}{2}\)(20+(15 – 7)) × \(v\) implied by \(14v\) or \(\frac{28v}{2}\) or M1 for an attempt at area e.g. one of the three areas correct e.g. \(\frac{1}{2}\) × 7 × \(v\) M1 for their 231 ÷ their 14 oe If 0 or M1 scored, instead award SC2 for answer 16.5 with no or insufficient working | “Correct working” requires evidence of at least M1 AND M2 Condone letters other than \(v\) and working could be on the diagram. in parts \(\frac{1}{2}\) × 7 × \(v\) + (15−7) × \(v\) + \(\frac{1}{2}\) ×(20−15) × \(v\) For M2 allow a proportionality argument e.g. \(\frac{1}{2}\) × 7 mins + (15 − 7) mins + \(\frac{1}{2}\) × (20 − 15) mins [= 14 mins at \(v\) m/min] their 231 is any number derived from 11.55 and implied by 0.825 and their 14 has got to be an attempt at the whole ‘area’ implied by e.g 20 condone the use of trials, we must see one at 16.5, award M2 for a trial at 16.5 and M1 for any other positive trial (see appendix) |
Appendix: Question 19
Trials are for values of \(v\) and evaluate the area ÷20 so here are some :
| \(v\) | average speed |
|---|---|
| 1 | 0.7 |
| 2 | 1.4 |
| 3 | 2.1 |
| 4 | 2.8 |
| 5 | 3.5 |
| 6 | 4.2 |
| 7 | 4.9 |
| 8 | 5.6 |
| 9 | 6.3 |
| 10 | 7 |
| 11 | 7.7 |
| 12 | 8.4 |
| 13 | 9.1 |
| 14 | 9.8 |
| 15 | 10.5 |
| 16 | 11.2 |
| 17 | 11.9 |
| 18 | 12.6 |
| 19 | 13.3 |
| 20 | 14 |
| 16.5 | 11.55 |