
Foundation November 2023 Paper 3 Q19
19 Beth completes some jigsaw puzzles and records the following information.
- The number of pieces in the jigsaw puzzle.
- The time taken to complete the jigsaw puzzle, in minutes.
Beth shows this information in a scatter diagram.
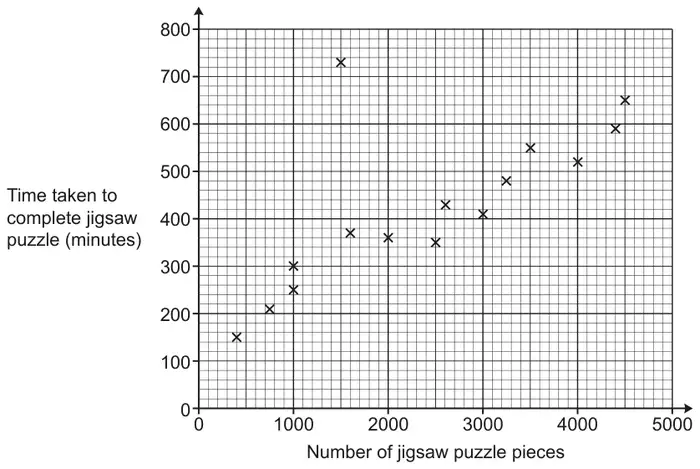
(a)
(i) Beth completes two more jigsaw puzzles.
- A 3000 piece jigsaw puzzle taking 460 minutes.
- A 1300 piece jigsaw puzzle taking 320 minutes.
Show this information on the scatter diagram. [1]
(ii) Describe the type of correlation shown on the scatter diagram. [1]
(b) One of Beth’s jigsaw puzzles was described as “the most difficult jigsaw puzzle you will ever try”.
(i) Circle the most likely jigsaw puzzle on the scatter diagram. [1]
(ii) Give a reason why you chose this jigsaw puzzle. [1]
(c)
(i) Draw a line of best fit on the scatter diagram. [1]
(ii) Use your line of best fit to estimate how many pieces are in a jigsaw puzzle that takes Beth 500 minutes to complete. [1]
(d) Explain why Beth should not use her scatter diagram to estimate how long it will take to complete a jigsaw puzzle containing 8000 pieces. [1]
| Answer | Marks | Part marks and guidance | |
|---|---|---|---|
| (i) Points plotted at (3000, 460) and (1300, 320) | 1 | Half square tolerance Use overlay as guide | |
| (ii) Positive | 1 | Ignore reference to strength | |
| Answer | Marks | Part marks and guidance | |
|---|---|---|---|
| (i) Point at (1500, 730) circled | 1 | ||
| (ii) The jigsaw took a long time for a small/similar number of pieces oe | 1 | See appendix Must include reference to both the time taken and the number of pieces | |
Appendix
Question 19b(ii)
| Statement | Reason | Mark |
|---|---|---|
| It has a small number of pieces but takes a long time to complete | 1 | |
| It took the longest even though it only had 1500 pieces | Assume time | 1 |
| Because it took the most minutes even with low pieces | 1 | |
| It had the most amount of time to complete | No reference to number of pieces | 0 |
| It took more time than others | No reference to number of pieces | 0 |
| It took the most amount of time for a 1500 piece puzzle | Too specific not referencing other puzzles and, thus, incorrect | 0 |
| It took the most amount of time compared to other puzzles | No reference to number of pieces. Just like saying “It took longest” | 0 |
| Most average area for this puzzle piece most average number and time taken | Garbled | 0 |
| It is furthest away from the line of best fit and the rest of the results | True depending on the line calculated/drawn but there will always be one such point and not all will be an outlier | 0 |
| Because it is not near the points towards the line | Getting there but which points are they thinking of? | 0 |
| It doesn’t fit the trend | Vague | 0 |
| It doesn’t follow the correlation of the other points | Doesn’t explain why and others could do the same | 0 |
| Answer | Marks | Part marks and guidance | |
|---|---|---|---|
| (i) Ruled line of best fit drawn | 1 | Condone good freehand Line must reach between (500, 120) and (500, 220) AND (4500, 540) and (4500, 660) | |
| (ii) Their straight line used to give number of pieces for 500 minutes | 1 FT | Strict FT from their intended straight line of best fit | Tolerance ± 50 pieces (½ small square = 50 pieces) If intersection between vertical gridlines allow reading at either gridline e.g. 3340 may be 3300 or 3400 Mark to candidate’s benefit |
| Answer | Marks | Part marks and guidance | |
|---|---|---|---|
| [8000 pieces is] beyond the given data oe or the trend/pattern may not continue oe | 1 | See appendix Do not accept “It only goes up to 5000” or “It goes off the scale” or any suggestion that the graph is not big/accurate enough Interpret “it” as reference to scale/diagram unless otherwise qualified | |
Appendix
Question 19d
| Statement | Reason | Mark |
|---|---|---|
| It only goes up to 5000 and it may differ with a much larger jigsaw | First part does not score the mark but BOD second part recognises trend not continuing | 1 |
| She shouldn’t because on of (none of?) the pieces is nowhere near the other pieces so she will get it wrong. | BOD beyond the data and not referring to scale | 1 |
| 8000 is beyond the range, her data only provides up to 5000 pieces | OK as references data not scale | 1 |
| Her values aren’t great enough | Not clearly saying that these are beyond data. Could be referring to scales | 0 |
| The graph doesn’t go that far | Referring to scales | 0 |
| The pieces could be easier so less time | Incorrect on all counts | 0 |
| There’s not 8000 pieces, it only goes up to 5000 | It taken to be a reference to scale | 0 |
| 8000 is not on the diagram | Referring to size of diagram and not range of the data | 0 |
| The data wasn’t given | Unclear, as this may mean that 8000 is not a plotted point | 0 |