
Foundation November 2021 Paper 2 Q18
18 The table shows the marks obtained by 10 students in spelling tests in January and February.
| Mark in January | 26 | 53 | 50 | 48 | 30 | 66 | 70 | 44 | 37 | 38 |
|---|---|---|---|---|---|---|---|---|---|---|
| Mark in February | 42 | 58 | 68 | 58 | 66 | 82 | 86 | 60 | 48 | 50 |
The marks for the first six students are plotted on the scatter diagram.
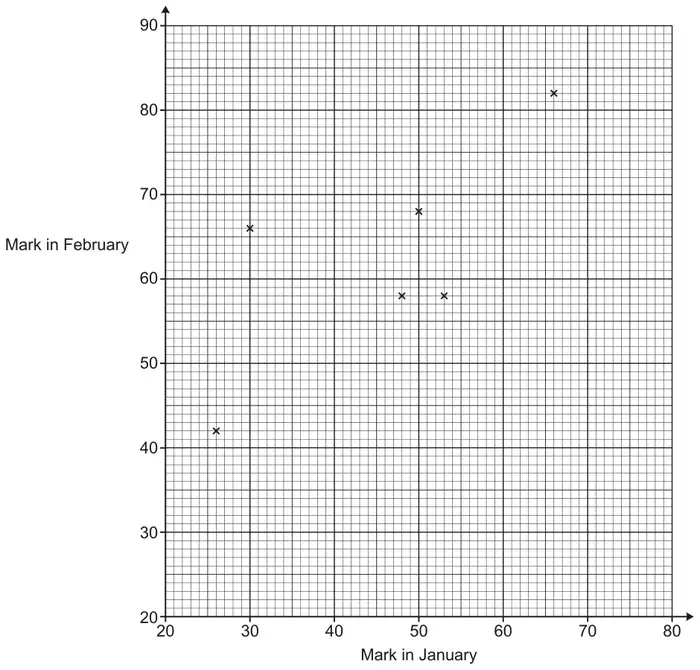
(a) Plot the marks for the remaining four students. [2]
(b) Describe the type of correlation shown in the completed scatter diagram. [1]
(c)
(i) On the scatter diagram, circle the student that made the greatest improvement in their marks from January to February. [1]
(ii) Work out the percentage change in this student’s marks from January to February. [3]
(d) Another student, Kai, scored 79 marks in the test in January but was absent for the test in February.
Kai says
I could use a line of best fit on the scatter diagram to estimate the marks I may have achieved in the test in February.
Is Kai’s method reliable?
Give a reason for your answer. [1]
| Answer | Marks | Part marks and guidance | |
|---|---|---|---|
| Four correct plots \((70, 86)\) \((44, 60)\) \((37, 48)\) \((38, 50)\) | 2 | B1 for 2 or 3 correct plots | Overlay gives guidance, tolerance \(\pm\tfrac{1}{2}\) small square |
| Answer | Marks | Part marks and guidance | |
|---|---|---|---|
| Positive | 1 | Ignore embellishments | |
| Answer | Marks | Part marks and guidance | |
|---|---|---|---|
| (i) Circles \((30, 66)\) only | 1 | Accept any clear indication | |
| (ii) 120 | 3 | M2 for \(\dfrac{66 - 30}{30}\) \([\times 100]\) oe or for \(\dfrac{66}{30} \times 100\) [\(-100\)] oe or M1 for \(\dfrac{66}{30}\) oe or for \(66 - 30\) oe | For M2 and M1 FT their (c)(i), point must be chosen for FT (table or graph) M2 implied by 1.2 or 220 M1 implied by 2.2 or 36 |
| Answer | Marks | Part marks and guidance | |
|---|---|---|---|
| No and line of best fit should not extend beyond data provided oe | 1 | e.g. only have data up to 70 marks, No one scored that high [so the trend may not continue] He would need to extrapolate beyond the line of best fit Do not accept e.g. the graph only goes up to 90 for the second test | |