
Higher November 2023 Paper 5 Q16
16 The box plot shows the distribution of the times, in seconds, taken by class 11P to complete a problem.
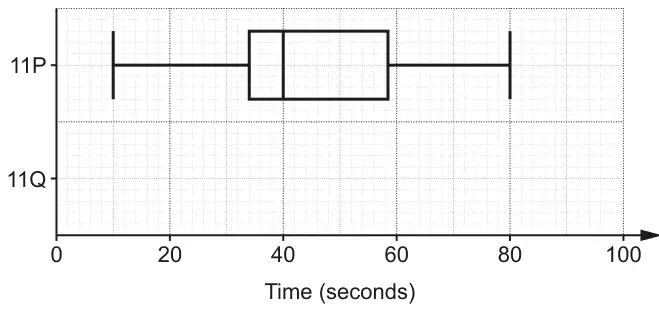
(a) The times, in seconds, taken by class 11Q to complete the same problem are summarised below.
- median = 52
- lower quartile = 42
- interquartile range = 18
- range = 70
- highest score = 86
Show the distribution of 11Q’s times as a box plot on the diagram above. [3]
(b) Which class has the more consistent times?
Give a reason for your answer. [1]
Give a reason for your answer. [1]
| Answer | Marks | Part marks and guidance | |
|---|---|---|---|
| Correct box plot | 3 | B2 for 4 or 5 correct markers or B1 for 3 correct markers or 16 or 60 soi | Markers must be associated with the correct statistic e.g do not allow median marked as UQ |
| Answer | Marks | Part marks and guidance | |
|---|---|---|---|
| 11Q [because] it has a smaller IQR oe | 1 | Accept: 11Q [because] its IQR is 18 but the IQR of 11P is 24 or 25 Do not accept if median also mentioned or if incorrect values given | |