
Foundation November 2022 Paper 2 Q21
21 The graph shows information about the population of a village.
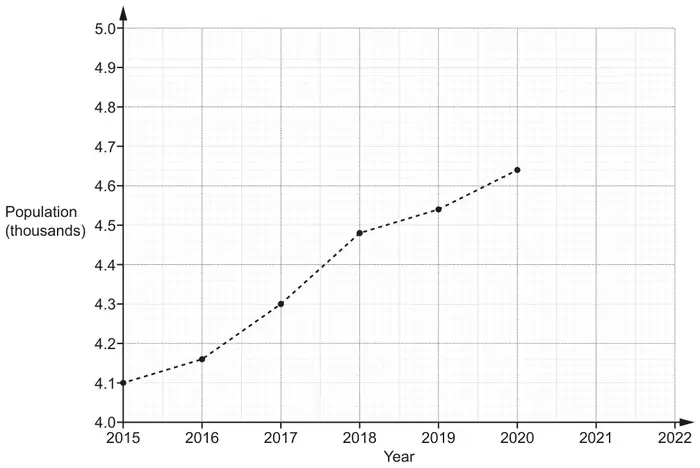
(a) The population of the village in 2021 was 4740.
Plot this point on the graph. [1]
(b) Work out the increase in the population of the village between 2016 and 2018. [2]
(c) Rowan says that there was a huge increase in the population of the village between 2015 and 2020.
Describe how Rowan may have been misled by the graph. [1]
(d) Blake says that the population of the village will be greater than 4800 in 2022.
Write down an assumption Blake has made. [1]
| Answer | Marks | Part marks and guidance | |
|---|---|---|---|
| Point correctly plotted | 1 | Accuracy \(\pm\) ½ small square radially, use overlay as a guide | |
| Answer | Marks | Part marks and guidance | |
|---|---|---|---|
| 320 | 2 | B1 for answer figs 32 or for 4160 or 4480 | Don’t accept percentages. |
| Answer | Marks | Part marks and guidance | |
|---|---|---|---|
| Only part of vertical scale is shown oe | 1 | e.g. Because the population axis starts at 4000, 4.0 [thousand] Vertical axis does not start at 0 She may have just looked at the steepness of the graph and not the scale of the graph/numbers Accept it only goes up by 540 See AG Any incorrect statements/incorrect specific values scores zero | |
Appendix
Appendix Q21c
| Response | Mark | |
|---|---|---|
| 1 | It/the graph/ [y] axis/the population/the scale does not start at zero | 1 |
| 2 | Hasn’t realised the population is only going up by 100 each time, so it isn’t a huge increase (BOD implied axis and info on scale provided – huge increase implies steepness) | 1 |
| 3 | It has only gone up by 540 [people] (accept reference to the value of the increase if value is correct) | 1 |
| 4 | The graph has gone up by a lot but it is only around 500 (accept reasonable approximation of increase with steepness implied) | 1 |
| 5 | The line on the graphs varied significantly but the value changed by only 600 (value is incorrect and no ref to steepness) | 0 |
| 6 | Each big tile is on the graph shows 100 people (not enough – need to refer to graph not starting as zero or steepness) | 0 |
| 7 | The steepness on the graph makes him think it has gone up a lot but the graph is going up in 1000s (1000s is incorrect we would accept 100s or 0.1s) | 0 |
| 8 | The y axis is too small so it makes it look like there has been a huge increase ( lacks detail about scale on y axis) | 0 |
| 9 | The scale makes it look like it has gone up a lot when it really only a little (not enough – needs to ref steepness and scale) | 0 |
| 10 | He used the steepness of the line to judge the increase ( needs detail about scale) | 0 |
| 11 | The continuing rising of the graph population and not reading the numbers properly (not enough – steepness and scale needed) | 0 |
| 12 | Rowan didn’t read the graph correct. 2015=4100, 2020=4630. Not a huge increase (Error with one value 4630 – otherwise we would accept with accurate values also) | 0 |
| 13 | May have been misled by not reading the graph properly as it only went up by 640 (specific value given which is incorrect) | 0 |
| 14 | By not looking at the figures and going by the plots rising. (implies steepness but too vague with vertical scale) | 0 |
| 15 | Because of how much the line is rising may seem there is a rapid increase. ( no ref to scale) | 0 |
| 16 | He may think it goes up by thousands, but there has been less than a thousand people | 0 |
| 17 | By just looking at the plots on the graph and not looking at the actual numbers (right idea but need to ref steepness and scale) | 0 |
| 18 | As the graph is only going up 100 between each box yet he sees it large by the depth (not enough - if steepness rather than depth then fine) | 0 |
| 19 | Just because the line gets higher doesn't mean its a huge increase (need to ref scale) | 0 |
| 20 | Because the line increased by a lot, but the numbers didn't (not enough – need more detail about the scale) | 0 |
| 21 | May have been misled by the sharp diagonal line on the graph (no detail on scale) | 0 |
| Answer | Marks | Part marks and guidance | |
|---|---|---|---|
| Increasing trend continues oe | 1 | e.g. The population growth will continue the same as in previous years People will not leave the village and the increase continues If a number is given with the increase then it should be at least 60 See AG Any incorrect specific value(s) scores zero | |
Appendix
Appendix Q21d
| Response | Mark | |
|---|---|---|
| 1 | The population will increase at the same/constant rate | 1 |
| 2 | The population will continue to increase | 1 |
| 3 | The population will increase by [more than] a thousand/600/60 | 1 |
| 4 | The population will keep growing by birth or migration | 1 |
| 5 | The population will increase by 60, the population increases by more than 60 | 1 |
| 6 | The graph will follow the same trend | 1 |
| 7 | That the population will carry on rising like the past years | 1 |
| 8 | he has estimated this through the constant population increase (trend is implied, ignore constant) | 1 |
| 9 | The graph will continue growing in the same way and shape as it was this morning (Fine describes trend – ignore ref to morning) | 1 |
| 10 | because of how the previous years were going he thinks it will stay in that pattern (BOD stay in that pattern for trend) | 1 |
| 11 | the birth rate will stay the same (not enough to imply population will increase – deaths etc?) | 0 |
| 12 | 2022 will be greater than 4800 if 2021 is a population of 4740 (not enough as repeats what is in the question) | 0 |
| 13 | Blake may not be right as the population was increasing (does not describe the assumption) | 0 |