
Foundation June 2023 Paper 2 Q3
3 A store carries out a satisfaction survey on a sample of its customers.
The bar chart shows the results.
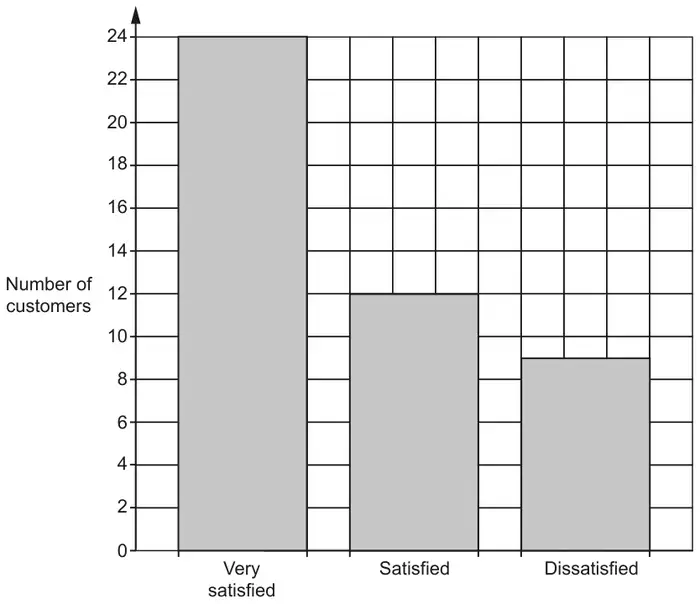
(a) Work out how many customers were in the sample. [2]
(b) The store manager decides to display the results in a pictogram.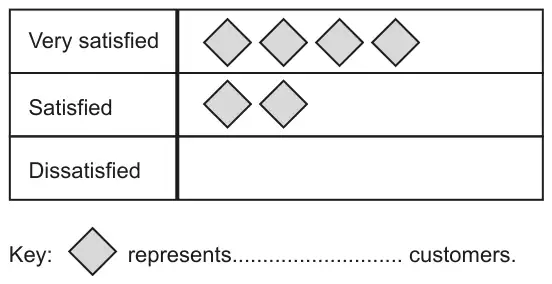
Complete the final row of the pictogram and the key.
[2]
| Answer | Marks | Part marks and guidance | |
|---|---|---|---|
| 45 | 2 | M1 for at least two of 24, 12 and 9 or for attempt to sum their three values | May be seen on bar chart their three values MUST be stated |
| Answer | Marks | Part marks and guidance | |
|---|---|---|---|
| \(1\dfrac{1}{2}\) squares drawn | 1 | Mark intention to draw half a square in any orientation. Allow for internal line of picture to be omitted. | |
| Key: 6 | 1 | ||