
Higher June 2023 Paper 6 Q1
1 Alex draws a bar chart to show the age of the young people attending a youth club.
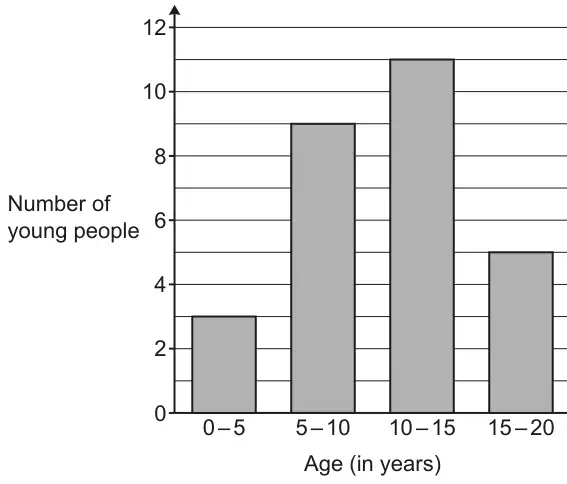
Make one criticism of Alex’s bar chart. [1]
| Answer | Marks | Part marks and guidance | |
|---|---|---|---|
| The [age] groups overlap oe | 1 | See appendix Mark the best part of a single statement provided no contradiction or incorrect statements If more than one criticism, mark the worst Allow describing one or more common values or giving correct scales | |
Appendix: Q1
| Response | Comment | Mark |
|---|---|---|
| It has overlapping numbers. | 1 | |
| Some numbers appear twice. | 1 | |
| Should be 0-5, 6-10 etc. | or 0 – 4 then 5 – 9 etc | 1 |
| Should be \(0 \leqslant h \lt 5\), \(5 \leqslant h \lt 10\) etc | Condone \(0 \lt h \leqslant 5\), \(5 \lt h \leqslant 10\) etc | 1 |
| The labels for the bars overlap | 1bod | |
| 10 is in both sets | Repeated value | 1 |
| the age is confusing because there’s 2 bars that 10 can go into | Repeated value | 1 |
| The age section of the graph use the previous number in each bar. | Repeated value | 1 |
| he uses the same age twice | Accept BOD to mean value repeated in two groups | 1 |
| he doesn’t need to put the same number that was at the end in the beginning | BOD repeated value | 1 |
| Some people could claim to be in two different bar charts (5, 10, 15) | BOD inclusion of charts and intention 5 – 10 and 10 - 15 | 1 |
| Should be \(0 \leqslant h \leqslant 5\), \(5 \leqslant h \leqslant 10\) etc | This does not resolve the issue of overlapping values | 0 |
| it didn’t have to go up in two’s as the number of people attending were all odd | False | 0 |
| you should not go if your 0 – 5 as it is very young to go to a youth club | Irrelevant | 0 |
| the bars aren’t all the same width | They are | 0 |
| The age gaps are too big | No criticism of the end points of the scale | 0 |
| There are gaps between the bars | 0 | |
| Age doesn’t start at 0. | 0 | |
| The categories could be more specific/are not accurate. | 0 | |
| Some young people are older than 20. | 0 | |
| Age is not a linear scale | 0 |