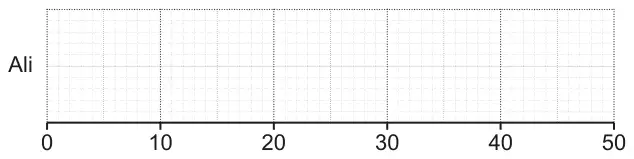
13 Ali and Beth take it in turns to play a computer game. On each turn, the player achieves a score out of 50. Ali and Beth play the computer game many times and record their scores.
(a) Ali’s scores are summarised below.
median = 31
highest score = 38
range = 23
lower quartile = 24
interquartile range = 11
Draw a box plot to show the distribution of Ali’s scores.
[3]
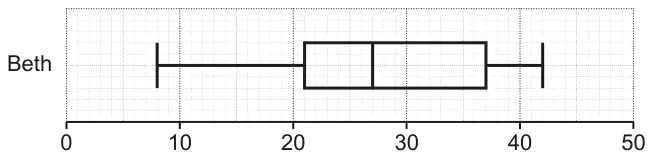
(b) This box plot shows the distribution of Beth’s scores.
Find the interquartile range of Beth’s scores. [2]
(c) Kareem says
Beth was more consistent than Ali because Beth had a lower median score.
Is his statement correct? Explain your reasoning. [2]
Mark scheme (a)
Answer
Marks
Part marks and guidance
Fully correct box plot
3
B1 for median at 31 B1 for highest at 38 and lowest at 15 B1 for UQ at 35 and LQ at 24
Use overlay and tolerance ±½ small square, condone freehand lines
Mark scheme (b)
Answer
Marks
Part marks and guidance
16
2
M1 for 21 or 37
Mark scheme (c)
Answer
Marks
Part marks and guidance
Accept “No” and any correct reasoning e.g. consistency is measured by [interquartile] range and Beth’s range is higher so less consistent
2
B1 for mention of [interquartile] range or spread or unclear acceptable statement
See appendix
Notes
(corrected from the printed mark scheme: the answer column prints “Bev’s range”; the question is about Beth)
Appendix: Exemplar responses for Q13(c)
Response
Mark
No + Ali is more consistent because his IQR is smaller
2
No + her data is more spread out
2
No + the median represents the average or middle value and not the range
2
No + median is just the middle mark
2
No+ the median does not measure consistency it is the range
2
No+ Kareem is wrong because Beth has the larger range
2
No + Beth is more consistent as her IQR/range is lower (1 for mention of IQR or range)