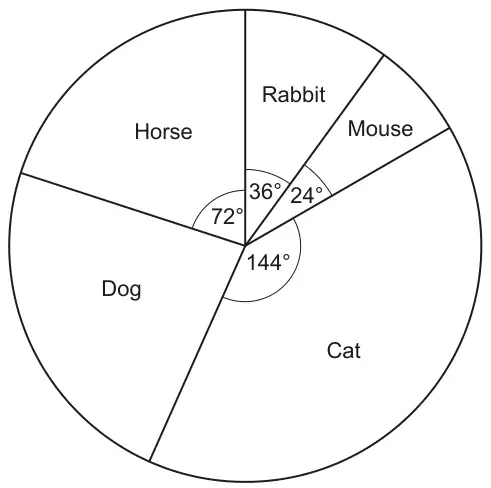
The pie chart shows the proportion of each type of pet owned by the 30 students.
(a) Which type of pet is the mode? [1]
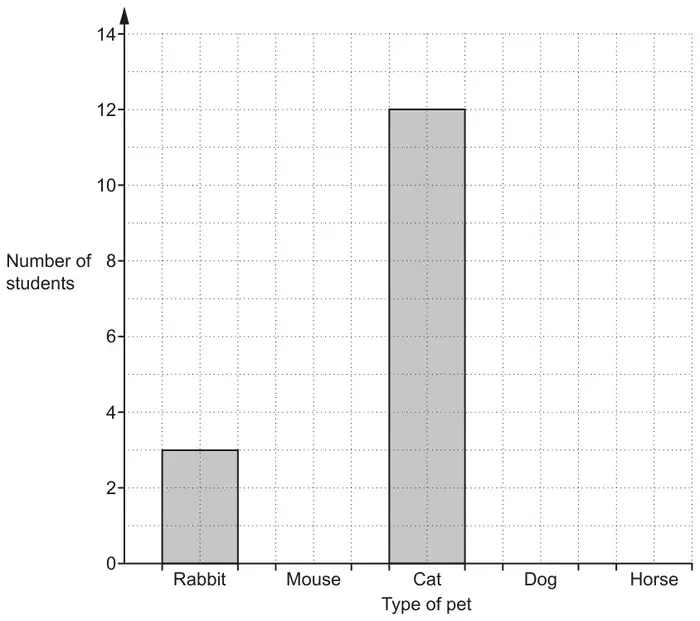
(b) Use the information in the pie chart to complete this bar chart.
[3]
Mark scheme (a)
Answer
Marks
Part marks and guidance
Cat
1
Mark scheme (b)
Answer
Marks
Part marks and guidance
Correct graph
3
B2 for two correct bars or three correct height bars but not all correct width or B1 for one correct height bar of any width or one of [mouse] 2 or [dog] 7 or [horse] 6 seen
If 0 scored, allow B1 for [dog] 84.
Three correct heights and correct widths with no daylight Condone freehand with lines on gridlines (no daylight). Use overlay