
Foundation November 2019 Paper 1 Q19
19 12 students take two tests.
Each test is out of 60.
The scatter diagram shows the results for 10 of the students.
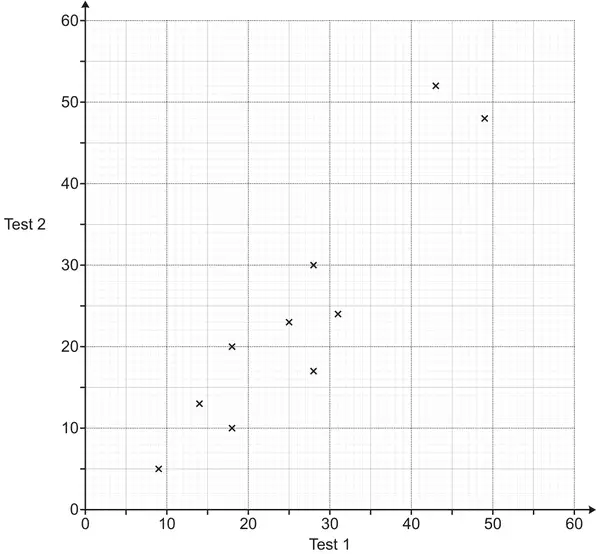
(a) The table shows the results for the other 2 students.
| Test 1 | 36 | 38 |
|---|---|---|
| Test 2 | 44 | 41 |
Plot these results on the scatter diagram. [1]
(b) Describe the type of correlation shown in the scatter diagram. [1]
(c)
(i) Draw a line of best fit on the scatter diagram. [1]
(ii) Another student was absent for Test 2.
The student scored 40 marks on Test 1.
The student scored 40 marks on Test 1.
Use your line of best fit to estimate a result for this student on Test 2. [1]
(d) Work out the percentage of the 12 students whose result on Test 1 is lower than their result on Test 2. [4]
| Answer | Marks | Part marks and guidance | |
|---|---|---|---|
| 2 points plotted correctly | 1 | tolerance ± ½ small square | |
| Answer | Marks | Part marks and guidance | |
|---|---|---|---|
| positive | 1 | Ignore embellishments | |
| Answer | Marks | Part marks and guidance | |
|---|---|---|---|
| (i) acceptable ruled line | 1 | see overlay, it must be at least from \(x = 10\) to \(x = 45\) and between (10,4) to (10,12) and (45,40) to (45,50) if more than 1 line, both must be in tolerance, ignore horizontal and vertical lines. | |
| (ii) 35 to 44 | 1 | for answers out of tolerance FT their ruled line with positive gradient with tolerance ± ½ small square | |
| Answer | Marks | Part marks and guidance | |
|---|---|---|---|
| 42 or 41.7 or 41.66… or 41.67 | 4 | B1 for 5 M1 for \(\dfrac{\textit{their } 5}{12}\) M1 for \(\left(\textit{their } \dfrac{5}{12}\right) \times 100\) If 0 scored SC2 for answer of 30 from \(\dfrac{3}{10}\) or 36[.36…] or 36.4 from \(\dfrac{4}{11}\) | their 5 must be less than 12 implied by [0].4166… |