
Foundation November 2018 Paper 3 Q1
1 In a survey, people were asked to choose their favourite type of pizza.
The pictogram shows some of the results.
8 people chose Margherita.
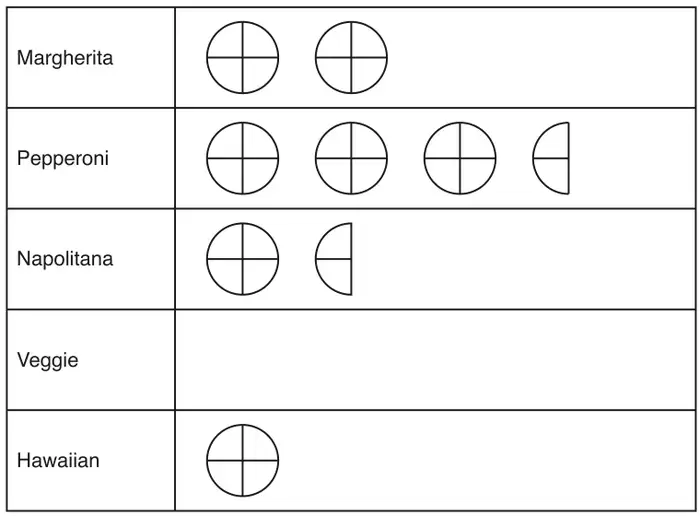

(a) Complete the key. [1]
(b) How many people chose Pepperoni? [1]
(c) There were 36 people in the survey.
All of these people chose one of the pizzas in the pictogram.
All of these people chose one of the pizzas in the pictogram.
Complete the pictogram for Veggie. [3]
| Answer | Marks | Part marks and guidance | |
|---|---|---|---|
| 4 | 1 | ||
| Answer | Marks | Part marks and guidance | |
|---|---|---|---|
| 14 | 1 | FT 3.5 \(\times\) their (a) | |
| Answer | Marks | Part marks and guidance | |
|---|---|---|---|
One whole circle  | 3 | B2 for 32 seen or [8, their 14], 6, 4 in correct place or [8,] 22, 28, 32 or B1 for one of 6, 4 in correct place or 22, 28 | Mark intention For 3 marks condone missing cross lines |