
Higher June 2022 Paper 5 Q14
14 In a survey about music, some students were asked whether they like pop (P) and whether they like rap (R).
The Venn diagram shows some of the results.
\(x\) students liked both types of music.
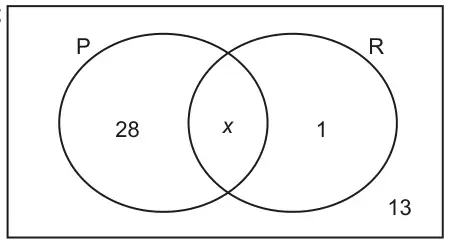
(a) The ratio of the number of students who liked pop to the number who liked rap was 5 : 2.
Work out the total number of students in the survey. [4]
(b) One of the students is selected at random.
Find the probability that this student does not like rap given that they like pop. [2]
| Answer | Marks | Part marks and guidance | |
|---|---|---|---|
| 59 | 4 | B3 for \(x = 17\) or M2 for \(2(x + 28) = 5(x + 1)\) oe or better or for 45 : 18 seen or M1 \((x + 28)\) and \((x + 1)\) seen or better | For M2 accept [P =] 45 and [R =] 18 (An answer of 76 may indicate this but check working for 45 and 18) For M1, could appear as \(\begin{matrix} 5 & 2 \\ x + 28 & x + 1 \end{matrix}\) or e.g. \(5y = 28 + x\) and \(2y = x + 1\) |
| Answer | Marks | Part marks and guidance | |
|---|---|---|---|
| \(\frac{28}{45}\) oe | 2FT | B2FT for \(\dfrac{28}{\textit{their}(a) - 14}\) dep on 0 < answer < 1 or B1 for numerator 28 or for denominator 45 or their (a) – 14 | isw cancelling/conversion For FT - if fraction is simplified or given as a decimal check for equivalents for B2FT or B1 B1 must be part of a proper fraction 0 < \(P\) < 1 |