
Foundation November 2017 Paper 1 Q17
17 The scatter diagram shows the results of 17 students in their French test and their German test.
Both tests are out of 100.
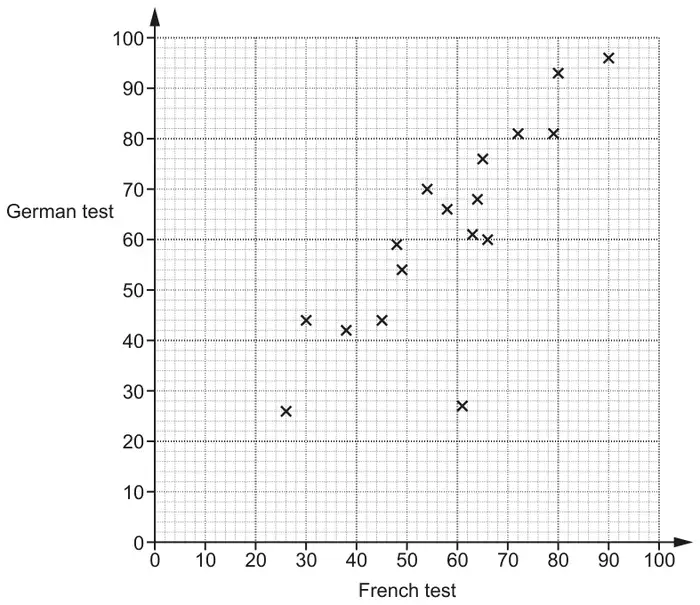
(a) Here are the results of another 4 students.
| French | 21 | 75 | 48 | 53 |
| German | 30 | 78 | 46 | 61 |
Plot these results on the scatter diagram. [2]
(b) Describe the type and strength of the correlation shown in this diagram. [2]
(c) Work out the percentage of the students whose German result was higher than their French result. [4]
| Answer | Marks | Part marks and guidance | |
|---|---|---|---|
| 4 points correctly plotted | 2 | B1 for 2 or 3 points | Tolerance \(\pm\) 1 mm |
| Answer | Marks | Part marks and guidance | |
|---|---|---|---|
| Strong / good | 1 | ||
| Positive | 1 | ||
| Answer | Marks | Part marks and guidance | |
|---|---|---|---|
| 71.[42…] or 71.4[3] nfww | 4 | B1 for 21 B1 for 15 M1 for (their 15) \(\div\) 21 \(\times\) 100 oe If 0 scored SC1 for ‘\(y = x\)’ drawn or, if points not plotted in (a), SC1 for \(\dfrac{12}{17}\) | 21 from 17 + 4 FT their diagram |