
Higher November 2017 Paper 6 Q10
10 This graph shows the world population, in billions, between 1951 and 2015.
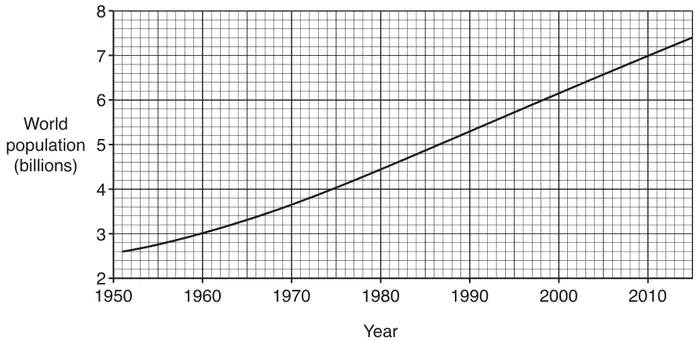
Use the graph to estimate the average rate of growth of the world population between 1951 and 2015.
Give suitable units for your answer. [3]
| Answer | Marks | Part marks and guidance | |
|---|---|---|---|
| 71 000 000 to 89 000 000 in figs or words | 2 | M1 for attempt to find ‘gradient’ using figures from the graph e.g. (7.4 – 2.6) ÷ (2015 – 1951) | Could be in billions Eg. (7 400 000 000 – 2 600 000 000) ÷ (2015 – 1951) For M1, condone incorrect conversion used consistently for both population figures. |
| and | |||
| people/year | 1 | ||