
Higher November 2017 Paper 5 Q15
15 Iqrah carries out a survey of 200 families in the north of England on their weekly spending on food.
The cumulative frequency diagram summarises the results.
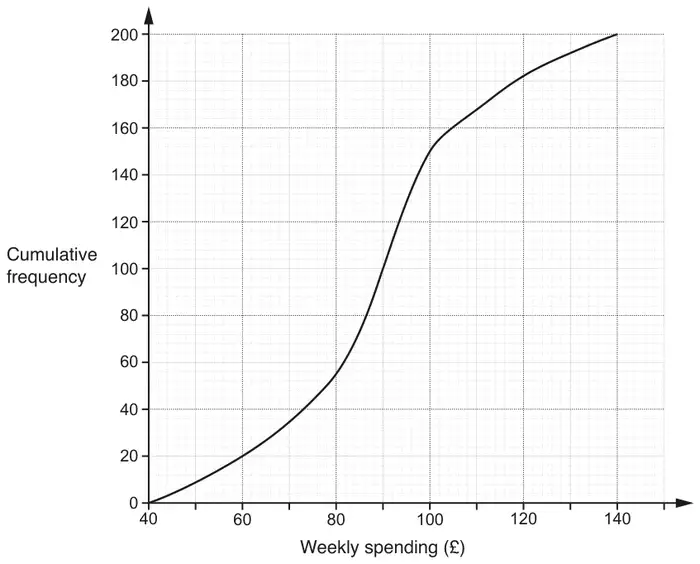
(a) Find
(i) the median, [1]
(ii) the interquartile range. [2]
(b) Iqrah says
15% of these families spent over £120.
Is her statement correct?
State the evidence you have used in making your decision. [2]
(c) In a survey of 200 families in the south of England, the median weekly amount spent on food was £84 and the interquartile range was £28.
Make two comparisons between the weekly amounts spent on food in the north of England and the south of England.
State the evidence you have used in making your comparisons.
1 [2]
2 [2]
| Answer | Marks | Part marks and guidance | |
|---|---|---|---|
| (i) 90 | 1 | ||
| (ii) 22 | 2 | M1 for [UQ = ]100 or [LQ = ] 77 to 79 | Accept 21 to 23 |
| Answer | Marks | Part marks and guidance | |
|---|---|---|---|
| No with 18 to 20 and 30 OR No with 8% to 10% [and 15%] OR No with [£] 110 to112 [which is less than 120] OR No with 170 and 180 to 184 | 2 | M1 for 18 to 20 or 8% to 10% or 110 to 112 or for 30 or 170 or 180 to 184 | Could be written on graph for M1 |
| Answer | Marks | Part marks and guidance | |
|---|---|---|---|
| Families in the south spent less on average as their median was lower oe | 2 | Strict FT their median in (a)(i) M1 for Families in the South spent less oe nfww | Allow either way around but do not allow M1 if wrong reason given e.g. in first reason mentions IQR for spending less Ignore ref to figures |
| Families in the south were more spread in their spending as their IQR was larger oe | 2 | Strict FT their IQR in (a)(ii) M1 for Spending varies more in the South oe nfww | For M1 allow spread oe associated with IQR without comparison |