
Higher November 2017 Paper 5 Q13
13 The graph shows information about the speed of a vehicle during the final 50 seconds of a journey.
At the start of the 50 seconds the speed is \(k\) metres per second.
The distance travelled during the 50 seconds is 1.35 kilometres.
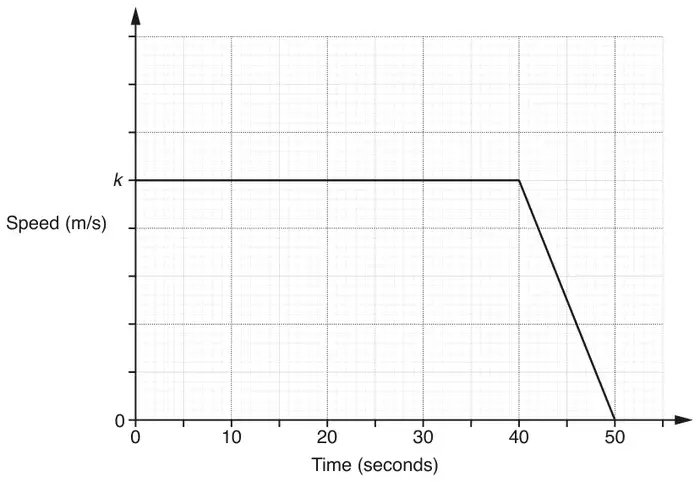
(a) Work out the average speed of the vehicle during the 50 seconds.
Give your answer in metres per second.
Give your answer in metres per second.
........................................ m/s [2]
(b) Work out the value of \(k\). [5]
(c)
(i) Calculate the gradient of the graph in the final 10 seconds of the journey. [1]
(ii) Describe what this gradient represents. [2]
| Answer | Marks | Part marks and guidance | |
|---|---|---|---|
| 27 | 2 | M1 for 1350 ÷ 50 If 0 scored SC1 for answer figs 27 | |
| Answer | Marks | Part marks and guidance | |
|---|---|---|---|
| 30 | 5 | B1 for 1350 M3 for 1350 = 40\(k\) + ½ ×10×\(k\) oe or M2 for 40\(k\) + ½ ×10×\(k\) oe or M1 for any attempt to find any relevant area under the graph | Condone figs 135 for M3 and variable other than \(k\) |
| Answer | Marks | Part marks and guidance | |
|---|---|---|---|
| (i) –3 | 1FT | FT (–their (b) ÷ 10) | |
| (ii) [Constant] deceleration oe | 1 | Condone acceleration The rate at which the speed changes | |
| m/s\(^2\) | 1 | ||