
Higher June 2018 Paper 4 Q14
14 The Venn diagram shows the number of students studying Mathematics (M) and the number of students studying Physics (P) in a college.
35 students do not study either subject.
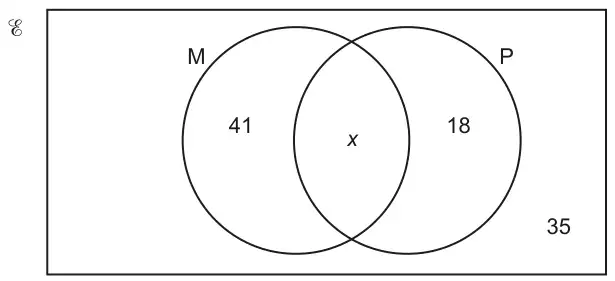
(a) The total number of students is 121.
Find the value of \(x\). [1]
(b) One of the 121 students is selected at random.
Find the probability that this student studies Mathematics, given that they study Physics. [2]
| Answer | Marks | Part marks and guidance | |
|---|---|---|---|
| 27 | 1 | ||
| Answer | Marks | Part marks and guidance | |
|---|---|---|---|
| \(\dfrac{27}{45}\) or \(\dfrac{3}{5}\) or [0].6 or \(\dfrac{\textit{their}\,(a)}{45}\) oe | 2 | B1 for \(\dfrac{27}{n}\) or \(\dfrac{\textit{their}\,(a)}{n}\) or \(\dfrac{k}{45}\) (\(n\), \(k\) are positive integers and fractions are proper) | Any fraction or percentage equivalent to \(\dfrac{27}{45}\) for 2 marks, the fractions must be proper and isw if conversion or cancelling after an acceptable answer |