
Foundation June 2018 Paper 2 Q10
10
(a) This Venn diagram shows the number of students in a Year 10 tutor group who study History (H) and Geography (G).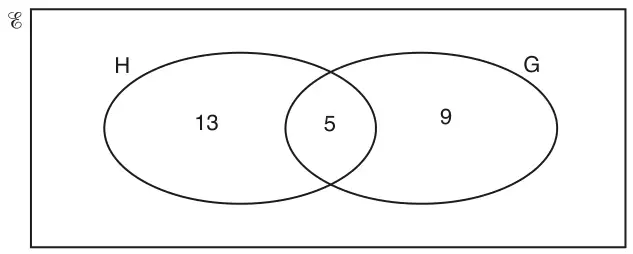
There are 29 students in the tutor group.
(i) How many students in the tutor group do not study History or Geography? [2]
(ii) How many students in the tutor group study History? [1]
(iii) One of the 29 students is selected at random.
What is the probability that they study Geography but do not study History? [1]
What is the probability that they study Geography but do not study History? [1]
(b) This diagram represents students in a tutor group who study Art (A) and Physics (P).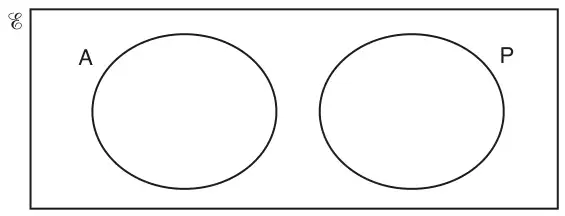
How many students study both Art and Physics? [1]
| Answer | Marks | Part marks and guidance | |
|---|---|---|---|
| (i) 2 | 2 | M1 for 29 – (13 + 5 + 9) oe | |
| (ii) 18 | 1 | ||
| (iii) \(\dfrac{9}{29}\) | 1 | Do not accept a ratio Do not accept eg 9 in 29 | |
| Answer | Marks | Part marks and guidance | |
|---|---|---|---|
| 0 | 1 | Accept none, zero, nil | |