
Higher November 2018 Paper 6 Q8
8 The graph shows the speed of a cyclist during 20 seconds of a journey.
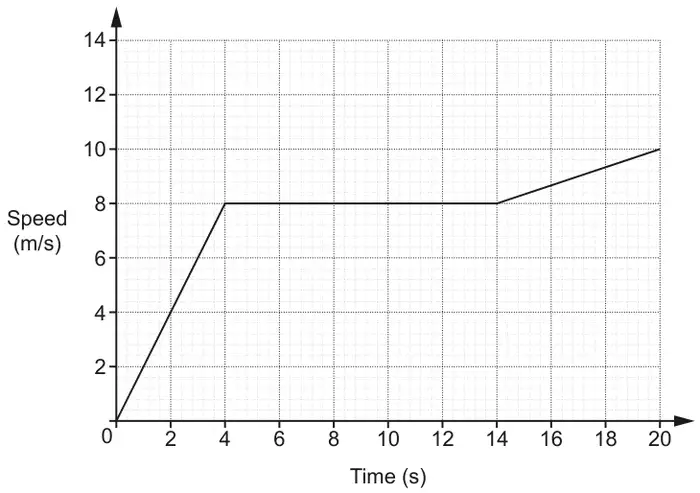
(a) Find the acceleration of the cyclist
(i) for the first 4 seconds [2]
(ii) between 4 seconds and 14 seconds. [1]
(b) Work out the distance travelled by the cyclist during the 20 seconds. [4]
| Answer | Marks | Part marks and guidance | |
|---|---|---|---|
| (i) 2 | 2 | M1 for ‘rise’ ÷ ‘run’ e.g. 8 ÷ 4 | |
| (ii) 0 | 1 | ||
| Answer | Marks | Part marks and guidance | |
|---|---|---|---|
| 150 | 4 | M3 for complete area \(\left[\dfrac{4 \times 8}{2} + (10 \times 8) + \dfrac{(8 + 10) \times 6}{2}\right]\) or M2 for two areas \(\dfrac{4 \times 8}{2}\) oe, \((10 \times 8)\) oe, or \(\dfrac{(8 + 10) \times 6}{2}\) oe or M1 for one area \(\dfrac{4 \times 8}{2}\) oe, \((10 \times 8)\) oe, or \(\dfrac{(8 + 10) \times 6}{2}\) oe | For M2 combining a triangle and a rectangle into a trapezium \(\dfrac{(14 + 10) \times 8}{2}\) counts as “two areas” Look for answers of 16, 80 and 54. Allow M marks for calculations from other suitable splitting of the areas |