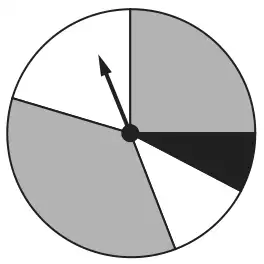
(a) This spinner has two grey sections, two white sections and one black section.
Vlad says
The probability of the spinner landing on black is \(\frac{1}{5}\).
Explain why Vlad is not correct. [1]
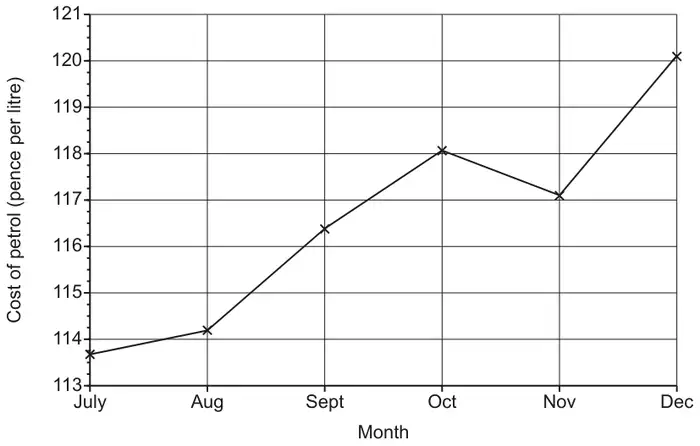
(b) The graph shows the cost of a litre of petrol for the last six months of 2017.
Explain why this graph is misleading. [1]
Mark scheme (a)
Answer
Marks
Part marks and guidance
Correct answer based on angle or area/arc length
1
The angle [for black] is too small oe or is less than a fifth oe or should be 72° oe The area/arc length [for black] is too small oe or is less than a fifth oe
Accept 26° to 30° for “the angle” Accept “not equal to” for “too small” or “less than” See appendix
Appendix: exemplar responses for Q3(a)
Response
Comment
Mark
The black section does not cover 1/5 of the spinner
“covering” implies area
1
The angle is 28°. It should be 72°.
1
1/5 is 72° and the black section is less than this
1
The angle is only 28.
Implied comparison with correct angle BOD Minimum case
1
Because 30/360 is 1/12
Comparing angle as fraction with common numerator with 1/5 (which is given) (3/36 is not enough to compare)
1
Because 28/360 = 0.07[…] not 0.2
Correct comparison (but (26 to 30)/360 needed for evidence of working with angle)
1
The angle is 28°.
Does not say that it should be 72 or is too small
0
The sections are not of equal area
0
The sections are not of equal width
0
The black section is the smallest section
0
The spinner is unequal and some spaces are the same colour but different size
0
It’s more like a tenth
No angle used to justify
0
Mark scheme (b)
Answer
Marks
Part marks and guidance
Any comment recognising limitations in range of the vertical scale
1
e.g. It does not start at zero or It starts at 113 See appendix
Appendix: exemplar responses for Q3(b)
Response
Comment
Mark
The graph starts at 113
Recognises limitation in scale
1
The y-axis is only from 113 to 121
Recognises limitation in scale
1
Because you don’t see anything below 113
Recognises limitation in scale
1
You can’t read between the numbers on the scale
Does not recognise limitations in the range of the scale
0
It doesn’t start from the bottom of the graph and the units go up in an unusual pattern.
Too vague.
0
It looks as though there has been a drastic increase in price when there hasn’t.