
Higher January 2019 Paper 2 Q19
19 The histogram shows information about the numbers of minutes some people waited to be served at a Post Office.
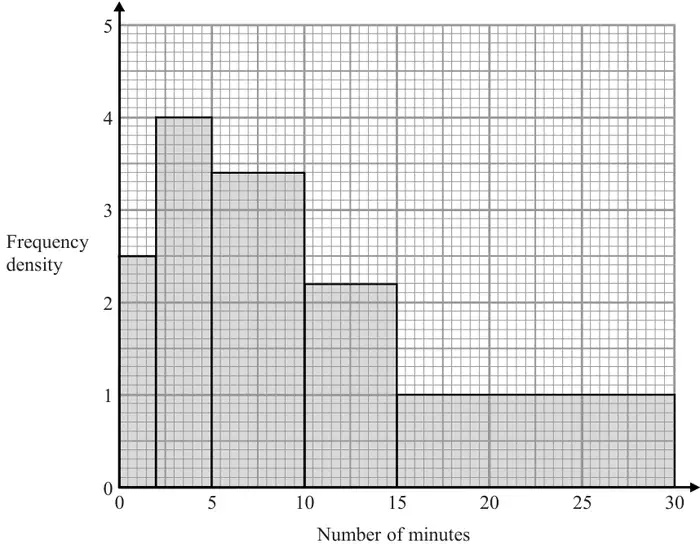
Work out an estimate for the proportion of these people who waited longer than 20 minutes to be served.
(3)
| Scheme | Marks |
|---|---|
| At least 2 of: \(2.5 \times 2\) (=5) or \(4 \times 3\) (=12) or \(3.4 \times 5\) (=17) or \(2.2 \times 5\) (=11) or \((1 \times)\ 15\) or \((1 \times)\ 10\) (=10) or e.g. at least 2 of 100, 240, 340, 220, 300 or 200 | M1 |
| \(2.5 \times 2 + 4 \times 3 + 3.4 \times 5 + 2.2 \times 5 + (1 \times)\ 15\) or \(5 + 12 + 17 + 11 + 15\) (=60) or e.g. \(100 + 240 + 340 + 220 + 300\) (=1200) | M1 |
| \(\dfrac{1}{6}\) oe | A1 |
| (3) | |
| (3 marks) |
Notes
M1: for working with area of at least 2 bars
could be using freq density × mins
or
use of counting squares or blocks
M1: for method to find total number of people (allow one error)
or
total number of squares/blocks for method used (allow one error)
A1: for \(\dfrac{1}{6}\) or \(16.\dot{6}\%\) or \(0.1\dot{6}\) or 1 in 6
(percentage or decimal rounded or truncated to 3 or more sig figs)