
Higher June 2019 Paper 1R Q17
17 The histogram shows information about the ages of all the passengers travelling on a plane.
No one on the plane is older than 80 years.
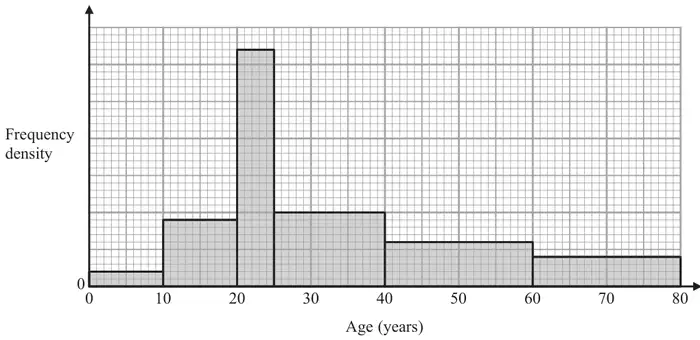
24 passengers on the plane are aged between 40 years and 60 years.
(a) Work out the total number of passengers on the plane. (3)
A passenger on the plane is picked at random.
(b) Work out an estimate for the probability that this person is older than 55 years. (2)
| Scheme | Marks |
|---|---|
| e.g. one correct value on the vertical scale e.g. 1 at 1 cm high or 1 cm2 = 5 passengers or 5 small squares = 1 passenger or (FD =) 24 ÷ 20 (= 1.2) | M1 |
| 10×0.4 (= 4) 10×1.8 (= 18) 5×6.4 (= 32) 15×2 (= 30) 20×0.8 (= 16) | M1 |
| 124 | A1 |
| (3) |
Notes
M1: For a correct scale on the vertical axis or a 1 cm × 1 cm square = 5 passengers or other correct scale or one correct product or frequency (other than the 24) or (FD =) 24 ÷ 20 (= 1.2)
M1: At least 3 correct products or frequencies (other than the 24) stated (could be seen on diagram)
| Scheme | Marks |
|---|---|
| e.g. 0.25 × 24 + 20 × 0.8 (= 22) or “1.2” × 5 + 20 × 0.8 (= 22) | M1 |
| \(\dfrac{\text{``}{22}\text{''}}{\text{``}{124}\text{''}}\) | A1ft |
| (2) | |
| (5 marks) |
Notes
M1: ft from (a)
A1ft: oe (0.17(741…))