
Higher June 2018 Paper 2 Q20
20 The histogram shows information about the birth weights of some babies.
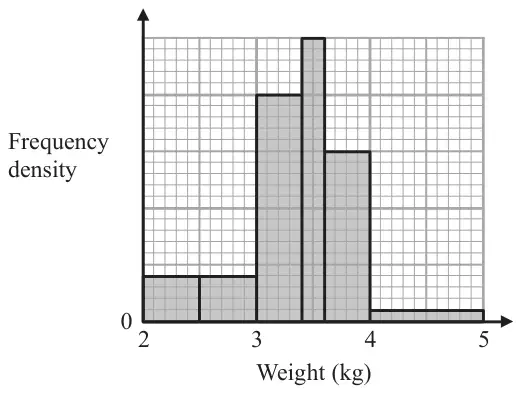
6 of these babies had a birth weight less than 2.5 kg or greater than 4 kg.
Work out the number of babies who had a birth weight between 2.5 kg and 4 kg.
(3)
| Scheme | Marks |
|---|---|
eg 4 × 5 + 1 × 10 = 30 small squares for 6 babies or 30 ÷ 6 or 5 small squares represent 1 baby or height of first bar \(= \dfrac{4}{0.5}\) (= 8) or height of last bar \(= \dfrac{2}{1}\) (=2) or 1 small square vertically = FD of 2 or 1cm vertically = FD of 10 oe | M1 |
| eg (4 × 5 + 20 × 4 + 25 × 2 + 15 × 4) ÷ 5 or 4 + 40 × 0.4 + 50 × 0.2 + 30 × 0.4 or 4 + 16 + 10 + 12 oe | M1 |
| 42 | A1 |
| (3) | |
| (3 marks) |
Notes
M1: Start working with area being proportional to frequency or show the height of the first or last bar or show a correct scale on the frequency density scale, with no inconsistent values.
eg could be awarded by seeing total of little squares ÷ 5 oe
M1: Fully correct method, allow one error in products but must be the sum of 4 parts