
Higher June 2018 Paper 2R Q11
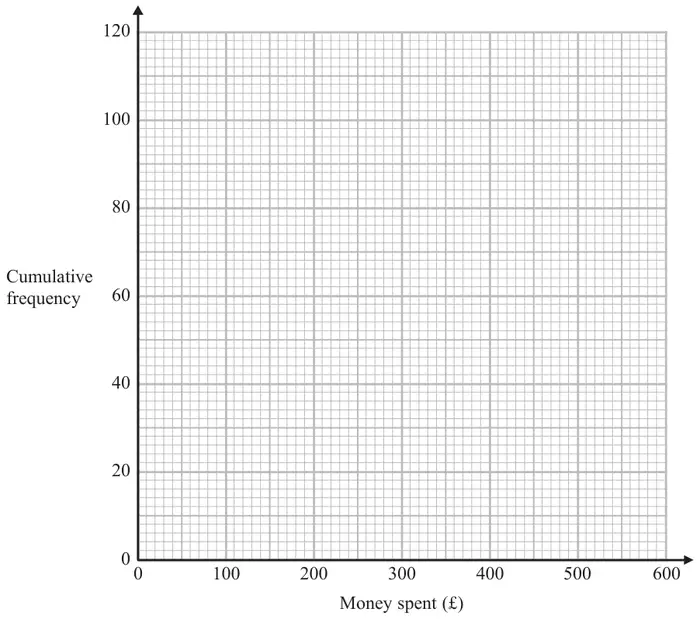
11 The table shows information about the amount of money spent on holiday by each of 120 families.
| Money spent (£\(m\)) | Frequency |
|---|---|
| \(0 \lt m \leqslant 100\) | 10 |
| \(100 \lt m \leqslant 200\) | 36 |
| \(200 \lt m \leqslant 300\) | 34 |
| \(300 \lt m \leqslant 400\) | 20 |
| \(400 \lt m \leqslant 500\) | 15 |
| \(500 \lt m \leqslant 600\) | 5 |
| Money spent (£\(m\)) | Cumulative frequency |
|---|---|
| \(0 \lt m \leqslant 100\) | |
| \(0 \lt m \leqslant 200\) | |
| \(0 \lt m \leqslant 300\) | |
| \(0 \lt m \leqslant 400\) | |
| \(0 \lt m \leqslant 500\) | |
| \(0 \lt m \leqslant 600\) |
| Scheme | Marks |
|---|---|
| \(100 \lt m \leqslant 200\) | B1 |
| (1) |
| Scheme | Marks |
|---|---|
| 10, 46, 80, 100, 115, 120 | B1 |
| (1) |
| Scheme | Marks |
|---|---|
| Correct cumulative frequency graph | B2 |
| (2) |
Notes
B2: fully correct cf graph – points at ends of intervals and joined with curve or line segments
If not B2 then B1 (ft from a table with only one arithmetic error) for 5 or 6 (ft from a table with only one arithmetic error) of their points at ends of intervals and joined with curve or line segments
OR for 5 or 6 points plotted correctly at ends of intervals not joined
OR for 5 or 6 of their points from table plotted consistently within each interval (not at upper ends of intervals) at their correct heights and joined with smooth curve or line segments
| Scheme | Marks |
|---|---|
| eg reading of 155 and 350 stated or indicated on graph | M1ft |
| 175 – 205 | A1ft |
| (2) |
Notes
M1ft: For use of 30 and 90, or 30.25 and 90.75, or ft from a cf graph provided method is shown.
A1ft: from their cf graph
| Scheme | Marks |
|---|---|
| M1 | |
| 12 or 13 | A1 |
| (2) | |
| (8 marks) |
Notes
M1: For reading off cf from money spent at £450 (108 ft)
A1: ft from cf graph