
Higher January 2019 Paper 1 Q9
9 The table shows information about the speeds of 60 cycles.
| Speed (\(s\) km/h) | Frequency |
|---|---|
| \(0 \lt s \leqslant 10\) | 3 |
| \(10 \lt s \leqslant 20\) | 16 |
| \(20 \lt s \leqslant 30\) | 24 |
| \(30 \lt s \leqslant 40\) | 10 |
| \(40 \lt s \leqslant 50\) | 5 |
| \(50 \lt s \leqslant 60\) | 2 |
(a) Complete the cumulative frequency table. (1)
| Speed (\(s\) km/h) | Cumulative frequency |
|---|---|
| \(0 \lt s \leqslant 10\) | |
| \(0 \lt s \leqslant 20\) | |
| \(0 \lt s \leqslant 30\) | |
| \(0 \lt s \leqslant 40\) | |
| \(0 \lt s \leqslant 50\) | |
| \(0 \lt s \leqslant 60\) |
(b) On the grid, draw a cumulative frequency graph for your table. (2)
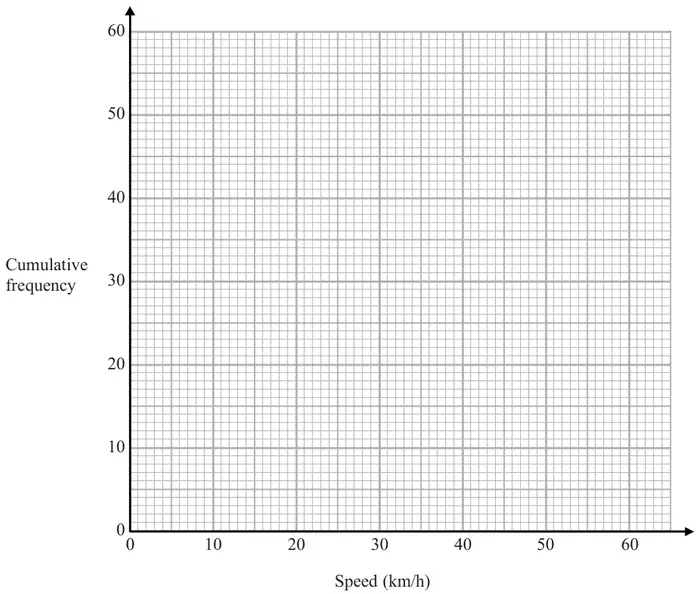
(c) Use your graph to find an estimate for the interquartile range of the speeds. (2)
| Scheme | Marks |
|---|---|
| 3, 19, 43, 53, 58, 60 | B1 |
| (1) |
| Scheme | Marks |
|---|---|
| M1 | |
| correct cf graph | A1 |
| (2) |
Notes
M1: ft from (a) if only one addition error for at least 4 points plotted correctly at end of interval or for all 6 points plotted consistently within each interval in the frequency table at the correct height (Eg. using values of 5, 15, 25 etc on \(x\) axis)
A1: accept curve or line segments
accept curve which is not joined to (0,0)
| Scheme | Marks |
|---|---|
| 15 and 45 indicated on the cumulative frequency axis and readings taken from speed axis | M1 |
| 13 – 15 | A1 |
| (2) | |
| (5 marks) |
Notes
M1: ft from a cf graph
for a correct method to find LQ and UQ and intention to subtract
Eg for a correct reading from 45/45.75 and 15/15.25 from vertical axis to find LQ and UQ and an intention to subtract
A1: accept 13 – 15
ft from a cf graph