
Higher January 2019 Paper 1R Q14
14 The cumulative frequency diagram gives information about the values, in thousands of euros, of 120 apartments in 2015
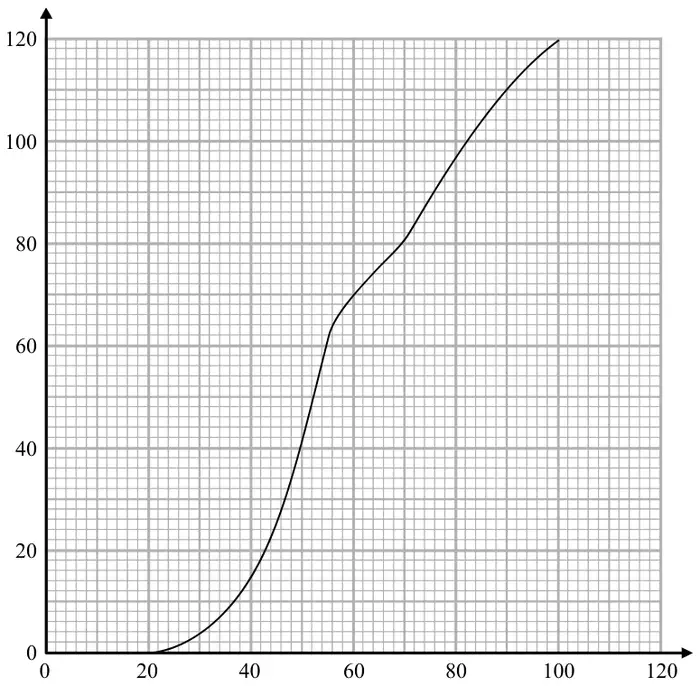
(a) Find an estimate for the number of these apartments with a value of 80 thousand euros or less in 2015 (1)
The table gives information about the values, in thousands of euros, of the same 120 apartments in 2018
| Value in thousands of euros (\(v\)) | Cumulative frequency |
|---|---|
| \(0 \lt v \leqslant 20\) | 0 |
| \(0 \lt v \leqslant 40\) | 15 |
| \(0 \lt v \leqslant 60\) | 44 |
| \(0 \lt v \leqslant 80\) | 85 |
| \(0 \lt v \leqslant 100\) | 102 |
| \(0 \lt v \leqslant 120\) | 120 |
(b) On the grid above, draw a cumulative frequency diagram for this information. (2)
(c) Find an estimate for the increase in the median value for these apartments from 2015 to 2018 (2)
| Scheme | Marks |
|---|---|
| 97 | B1 |
| (1) |
Notes
B1: 96 - 98
| Scheme | Marks |
|---|---|
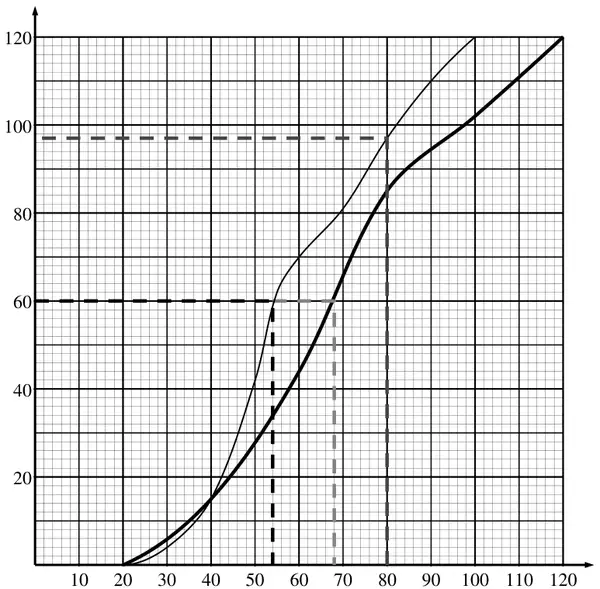 | M1 |
| Correct graph | A1 |
| (2) |
Notes
M1: for at least 4 points plotted correctly at end of interval
or
for all 6 points plotted consistently within each interval at the correct height
A1: accept curve or line segments
accept curve that is not joined to (0, 0)
| Scheme | Marks |
|---|---|
| M1 | |
| 14 | A1 |
| (2) | |
| (5 marks) |
Notes
M1: A line drawn at CF = 60 to meet at least one curve or sight of “55” or “69”
A1: 13 - 15 ft candidate's CFD