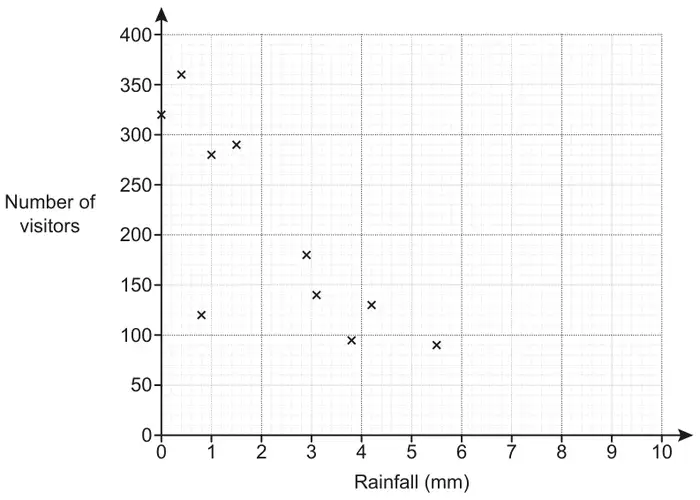
(a) The owner of a tourist attraction records the amount of rainfall, in millimetres, and the number of visitors each day.
The results for 10 days are shown in the scatter diagram.
(i) Circle the outlier on the scatter diagram. [1]
(ii) The owner claims that he would expect around 320 visitors on a day with 2 mm of rainfall.
Does the scatter diagram support his statement? Explain how you made your decision. [2]
(iii) Explain why the scatter diagram should not be used to estimate the number of visitors on a day with 9 mm of rainfall. [1]
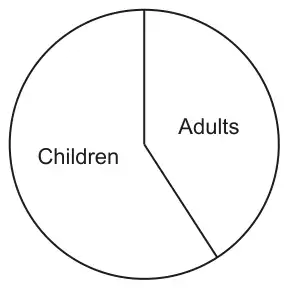
(b) The pie chart summarises information about the visitors to the tourist attraction on a different day.
Explain why the pie chart cannot be used to work out how many adults visited on that day. [1]
Mark scheme (a)
Answer
Marks
Part marks and guidance
(i) Point (0.8, 120) indicated
1
(ii) No oe and Correct supporting value(s) and justification
2
B1 for 200 to 260 visitors expected or about 0 to 1mm and 320 or line of best fit within overlay or negative trend/correlation or marking(s) in relevant region above 2mm or 2 or more values within overlay and surrounding 2mm
Justification includes Reference to line of best fit (drawn or not) or trend or negative correlation or marking(s) in relevant region above 2mm or surrounding values
See Appendix
(iii) Outside range of data [collected]
1
Accept “The data (or diagram) only goes to 5.5 (or 6)” oe
Do not accept “by 6 to 7 it would give no visitors” oe or There is no data around 9 mm oe The line of best fit does not reach 9 mm oe
Condone “[Because] there would be a negative number of people”
See Appendix
Appendix: Exemplar responses for Q3(a)(ii)
Response
Mark
(line drawn on graph) no, following the scatter diagram points there would be an estimate of around 240 visitors Take “following the scatter diagram points” refers to the line and a supporting value
2
no as with 1mm rain its 280 visitors so with 2mm you should get around 245 B1 for 245 expected at 2mm but no reference to trend
1
having drawn a line of best fit the scatter diagram wouldn’t support this as it’s too big a number No explicit supporting value used
1
no, by looking at the diagram you would expect about 240 Supporting value in range but no justification
1
no because with 1mm there’s less than 320 visitors 1 mm and 320 are the supporting values but no reference to trend
1
no because there were 320 visitors on a day with 0mm rainfall 0 mm and 320 are the supporting values but no reference to trend
1
the scatter diagram doesn’t support his statement as there isn’t any rainfall that is 2mm No supporting value
0
no it doesn’t because when the rainfall was 2mm he didn’t have any visitors Wrong
0
the closest amount of visitors to 2mm of rainfall is 290 An estimate that is out of range and is probably referring to the nearest point plotted. No reference to trend
0
No we expect 250 (reference to line or markings drawn)
2
No, a line of best fit would show 250 (no line)
2
No we expect 250 (nothing else)
1
(No valid comment) line of best fit within overlay
1
OR
No, 0-1 mm shows 320 but we would expect less as it is decreases/negative trend
2
No, 0-1 mm shows 320
1
No, 320 is for 1mm
1
No, negative trend
1
No, as on a day with 1mm there are fewer customers
0
OR
No, (point below 2mm and point above 2mm stated) so there is a negative trend
2
No, (point below 2mm and point above 2mm stated)
1
Yes …
0
Appendix: Exemplar responses for Q3(a)(iii)
Response
Mark
Outside range of data collected Perfect!!
1
because there is no data to show above 6mm of rainfall Equivalent answer
1
because the values of 7 and 8mm are not plotted, therefore it would be hard to estimate 9mm Similar to “no data around 9mm”
0
no record of any visitors are shown at 9mm of rainfall. Visitors stop coming when it hits 6mm of rainfall Equivalent to “no data for 9mm”
0
because there is not enough data to estimate the amount of visitors for 9mm of rainfall Does not say “no data beyond 5.5 (or 6) mm”
0
we don’t have the data to do a line of best fit Wrong
0
there is nothing recorded Wrong
0
you can’t plot this data the graph isn’t big enough Wrong
0
because that would create an outlier or anomalous piece of data Maybe but wrong
0
Mark scheme (b)
Answer
Marks
Part marks and guidance
Total number or number of children is not known oe or The chart only shows proportions/percentages oe
1
Mark the best bit so long as no contradiction
See Appendix
Appendix: Exemplar responses for Q3(b)
Response
Mark
The total number of visitors is not known True
1
there is no value of the amount of visitors that day For value read number
1
because there are more children and it don’t say how many there are in total Mark the best bit and no contradiction
1
there is no numbers to help us find our answer Too vague, could be referring to angles or number of adults
0
the pie chart doesn’t show any figures or percentages Too vague, could be referring to angles or number of adults (and final part incorrect)