
Higher January 2020 Paper 1 Q12
12 A total of 80 men and women took part in a race.
The cumulative frequency graph gives information about the times, in minutes, they took for the race.
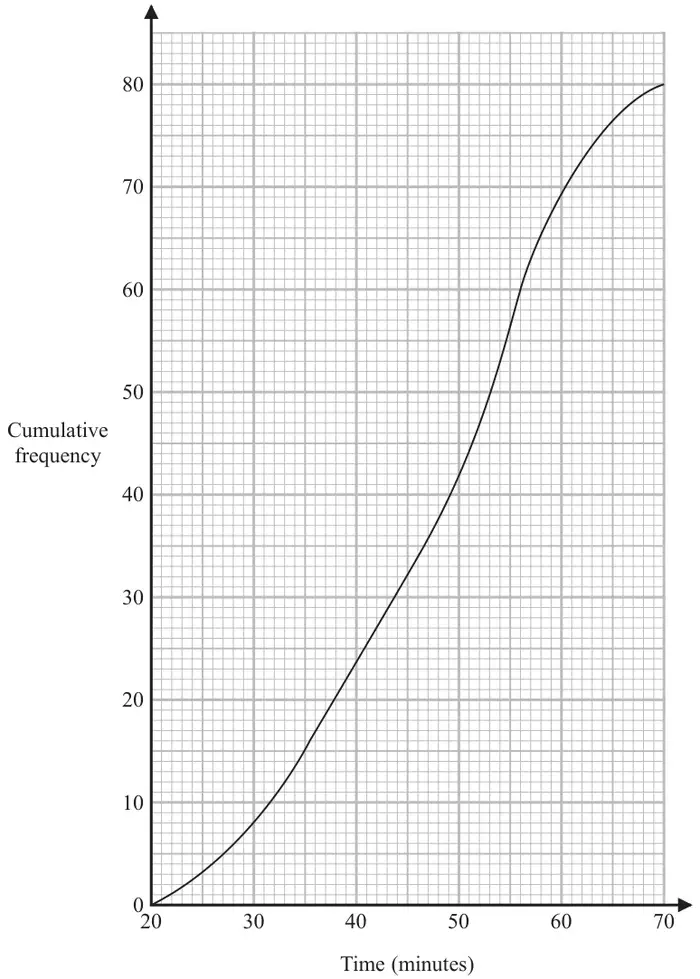
(a) Use the graph to find an estimate for the interquartile range. (2)
60% of the men took 50 minutes or less for the race.
No women took 50 minutes or less for the race.
(b) Work out an estimate for the number of men who took part in the race. (3)
| Scheme | Marks |
|---|---|
| E.g. 56 – 38 | M1 |
| 18 | A1 |
| (2) |
Notes
M1: for subtracting readings from 60 and 20 oe
A1: for answer in the range 17 – 19
| Scheme | Marks |
|---|---|
| [40.5, 43] | B1 |
| ‘42’ ÷ 0.6 oe | M1 |
| 70 | A1 |
| (3) | |
| (5 marks) |
Notes
M1: for complete method to find the number of men