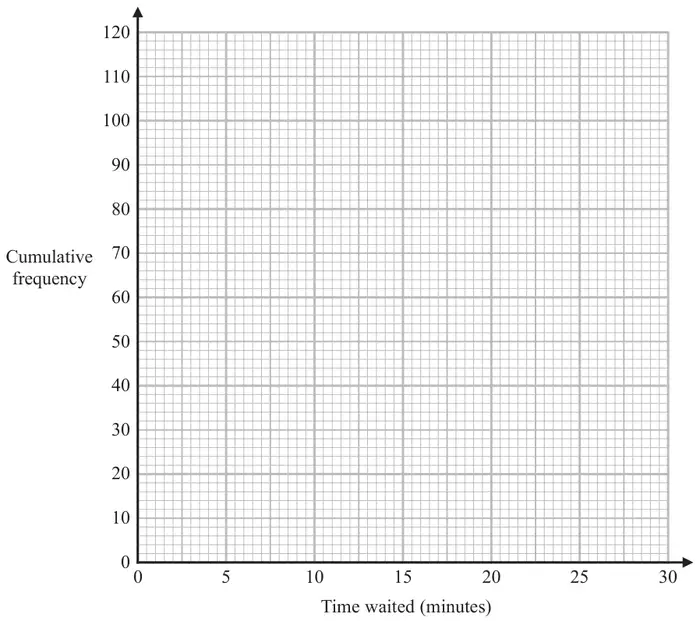
11 The manager of a call centre asked the 120 people, who rang the call centre last week, how long they each waited before their call was answered.
The table gives information about their replies.
Time waited (\(t\) minutes)
Frequency
\(0 \lt t \leqslant 5\)
8
\(5 \lt t \leqslant 10\)
15
\(10 \lt t \leqslant 15\)
17
\(15 \lt t \leqslant 20\)
28
\(20 \lt t \leqslant 25\)
33
\(25 \lt t \leqslant 30\)
19
(a) Complete the cumulative frequency table.
Time waited (\(t\) minutes)
Cumulative frequency
\(0 \lt t \leqslant 5\)
\(0 \lt t \leqslant 10\)
\(0 \lt t \leqslant 15\)
\(0 \lt t \leqslant 20\)
\(0 \lt t \leqslant 25\)
\(0 \lt t \leqslant 30\)
(1)
(b) On the grid below, draw a cumulative frequency graph for your table.(2)
(c) Use your graph to find an estimate for the median of the times waited. (1)
(d) Using your graph, find an estimate for the percentage of the 120 people who said that they waited longer than 23 minutes before their call was answered. Show your working clearly. (2)
Mark scheme (a)
Scheme
Marks
8, 23, 40, 68, 101, 120
B1
(1)
Mark scheme (b)
Scheme
Marks
M1
Correct cf graph
A1
(2)
Notes
M1: ft from table for at least 5 points plotted correctly at end of interval
or
ft from sensible table for all 6 points plotted consistently within each interval in the freq table at the correct height
A1: accept curve or line segments accept graph that is not joined to (0,0)
Mark scheme (c)
Scheme
Marks
17 – 20
B1
(1)
Notes
B1: ft their cf graph
Mark scheme (d)
Scheme
Marks
E.g. Reading at 23 minutes (= \(a\)) and then \((120 - a) \div 120 \times 100\)
M1
Working required Answer: 25(%) – 29(%)
A1
(2)
(6 marks)
Notes
M1: ft from their cf graph reading off at 23 minutes and a method to work out 120 minus this value as a percentage of 120