
Foundation November 2024 Paper 2 Q3
3 The vertical line chart shows the rainfall, in millimetres (mm), in March and April.
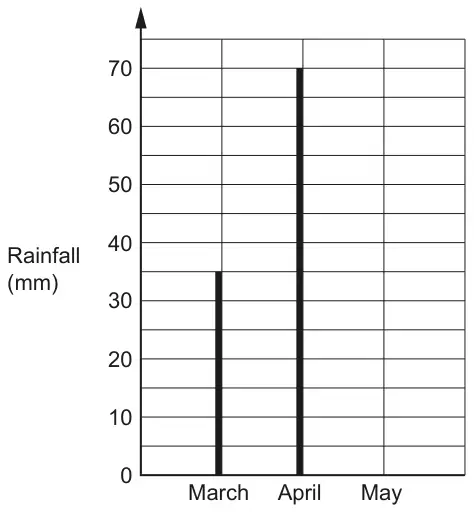
(a) Write down the rainfall in March. [1]
(b) In May there was 55 mm of rainfall.
Complete the vertical line chart for May. [1]
(c) Work out the total rainfall for March, April and May. [2]
| Answer | Marks | Part marks and guidance | |
|---|---|---|---|
| 35 | 1 | ||
| Answer | Marks | Part marks and guidance | |
|---|---|---|---|
| Line drawn to 55mm for May | 1 | Mark intention Condone freehand Allow slight inaccuracy, end of line should be on or within overlay Do not allow horizontal line drawn from 55 | |
| Answer | Marks | Part marks and guidance | |
|---|---|---|---|
| 160 | 2 | FT their 35 [+] 70 [+] 55 correctly evaluated B1 for 35 [+] 70 [+] 55 or B1FT: their 35 [+] 70 [+] 55 | FT for 2 marks “their 35” from 3(a) Values could be given on diagram in 3b |