
Foundation November 2024 Paper 1 Q13
13 Zayn drives from home to a shopping centre.
The graph shows information about the journey and the time spent at the shopping centre.
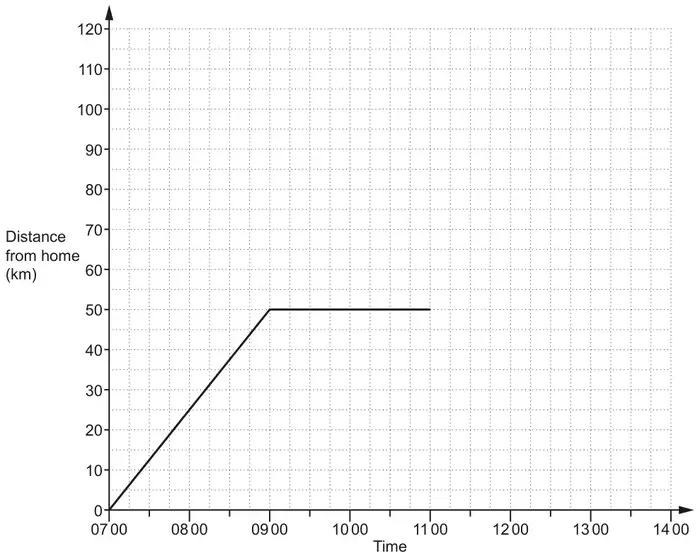
(a) State an assumption that has been made when the graph was drawn. [1]
(b) Write down the distance from Zayn’s home to the shopping centre. [1]
(c) Calculate Zayn’s average speed, in km/h, from home to the shopping centre. [2]
(d) Zayn leaves the shopping centre at 11 00.
Zayn drives home without stopping.
The journey home takes \(1\dfrac{3}{4}\) hours.
Zayn drives home without stopping.
The journey home takes \(1\dfrac{3}{4}\) hours.
Complete the graph to show this information. [2]
| Answer | Marks | Part marks and guidance | |
|---|---|---|---|
| Zayn travels at a constant speed | 1 | ||
| Answer | Marks | Part marks and guidance | |
|---|---|---|---|
| 50 | 1 | ||
| Answer | Marks | Part marks and guidance | |
|---|---|---|---|
| 25 | 2 | M1 for their (b) \(\div\) 2 | |
| Answer | Marks | Part marks and guidance | |
|---|---|---|---|
| Line or curve from (11 00, 50) to (12 45, 0) with no horizontal or vertical sections | 2 | B1 for line or curve reaching time axis after 11 00 or for 12 45 soi | eg a line ending at time 12 45 |