
Higher January 2023 Paper 2 Q12
12 The cumulative frequency graph gives information about the time, in minutes, each of 60 people took to shop in a market.
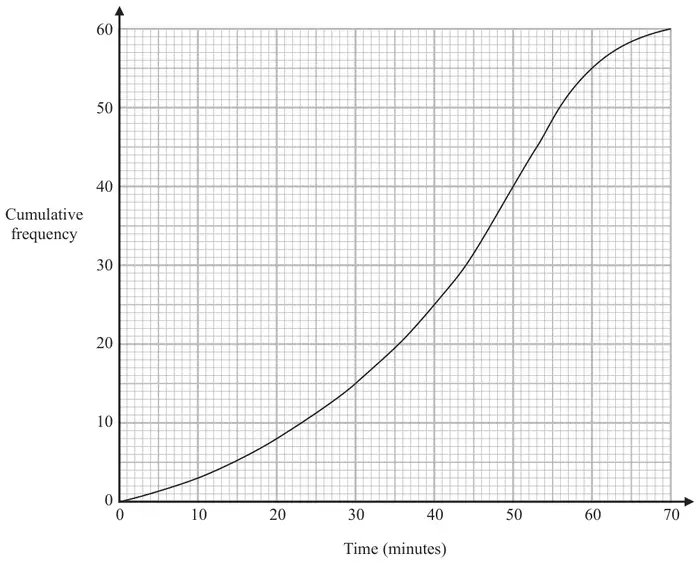
(a) Use the graph to find an estimate for the median time people took to shop in the market. (1)
(b) Use the graph to find an estimate for the number of people who took longer than 55 minutes to shop in the market. (2)
(c) Use the graph to complete the frequency table to give information about the time, in minutes, each of the 60 people took to shop in the market.
(2)
| Time taken to shop in the market (\(m\) minutes) | Frequency |
|---|---|
| \(0 \lt m \leqslant 10\) | 3 |
| \(10 \lt m \leqslant 20\) | 5 |
| \(20 \lt m \leqslant 30\) | |
| \(30 \lt m \leqslant 40\) | |
| \(40 \lt m \leqslant 50\) | |
| \(50 \lt m \leqslant 60\) | |
| \(60 \lt m \leqslant 70\) |
| Scheme | Marks |
|---|---|
| 43.5 – 44.5 | B1 |
| (1) |
Notes
B1: ±0.5 small square
| Scheme | Marks |
|---|---|
| eg reading of 48 – 49 | M1 |
| Correct answer scores full marks (unless from obvious incorrect working) Answer: 11 or 12 | A1 |
| (2) |
Notes
M1: For correct method to start the question eg a vertical line from 55 up to the line and a horizontal line from the correct point on the curve or a mark on the curve at the correct point and a mark on the vertical axis at the correct point
or a correct reading of 48 to 49
A1: Allow an answer of 11 or 12 (ie must be whole number)
| Scheme | Marks | ||||||||||||||||
|---|---|---|---|---|---|---|---|---|---|---|---|---|---|---|---|---|---|
| B2 | ||||||||||||||||
| (2) | |||||||||||||||||
| (5 marks) |
Notes
B2: All values correctly filled in (NB: first 2 are already completed)
(B1 for 3 or 4 correct values from 7, 10, 15, 15, 5)