
Higher January 2023 Paper 1R Q11
11 The table shows information about the times, in minutes, that 80 patients had to wait to see a doctor.
| Time (\(W\) minutes) | Frequency |
|---|---|
| \(0 \lt W \leqslant 10\) | 7 |
| \(10 \lt W \leqslant 20\) | 10 |
| \(20 \lt W \leqslant 30\) | 15 |
| \(30 \lt W \leqslant 40\) | 32 |
| \(40 \lt W \leqslant 50\) | 16 |
| Time (\(W\) minutes) | Cumulative frequency |
|---|---|
| \(0 \lt W \leqslant 10\) | |
| \(0 \lt W \leqslant 20\) | |
| \(0 \lt W \leqslant 30\) | |
| \(0 \lt W \leqslant 40\) | |
| \(0 \lt W \leqslant 50\) |
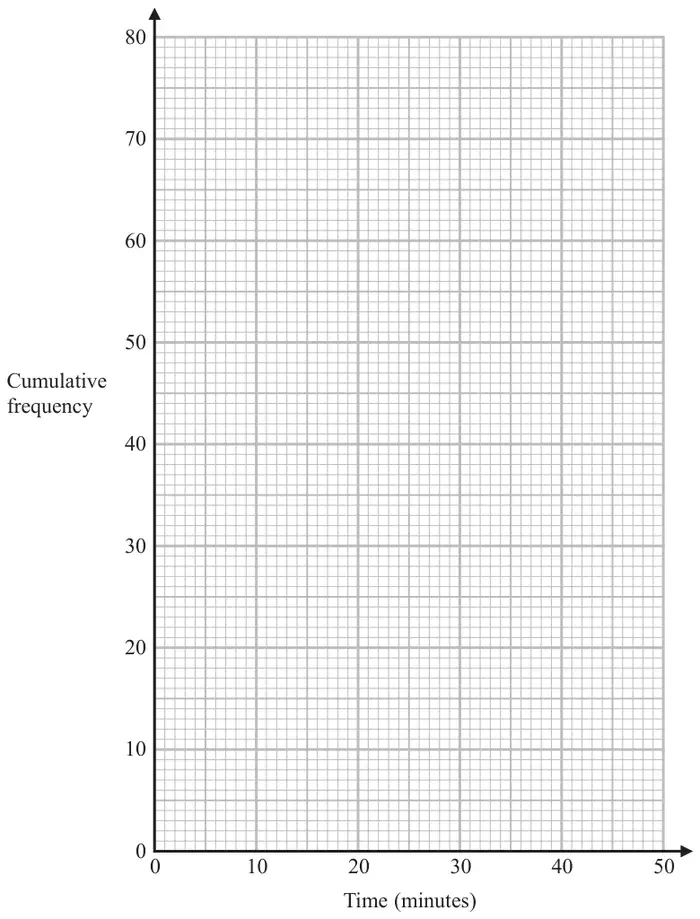
(2)
| Scheme | Marks |
|---|---|
| 7, 17, 32, 64, 80 | B1 |
| (1) |
Notes
B1: values seen in table
| Scheme | Marks |
|---|---|
| M1ft | |
| (NB: a ‘bar chart’ type graph scores zero marks) Answer: correct cf graph | A1 |
| (2) |
Notes
M1ft: for at least 4 points plotted correctly at end of interval or for all points plotted consistently within each interval of the associated frequency table (eg at 5, 15, 25, 35, 45 or 0, 10, 20, 30, 40) at the correct height.
ft their table dep on one error only in the table
A1: All points plotted correctly at end of interval (tolerance 1 small square – there is an overlay) and joined with a curve or line segments; accept curve that is not joined at (0, 0).
| Scheme | Marks |
|---|---|
| Accept a single value in the range OR ft their cf graph Answer: 33 | B1ft |
| (1) |
Notes
B1ft: Accept a single value in range 32 – 34 or ft their cf graph
| Scheme | Marks |
|---|---|
| NB: readings are 21 - 23 and 37 - 39 (but for this M1 these do not have to be correct if correct working is shown – eg lines or marks indicating use of CF 20 (or 20.25) and CF 60 (or 60.75) with an indication on the Time axis at the correct points (or they can just show the correct readings)) | M1ft |
| Accept a single value in the range OR ft their cf graph Answer: 16 | A1ft |
| (2) | |
| (6 marks) |
Notes
M1ft: For correct use of LQ and UQ and subtraction, ft from a cum freq graph provided method is shown – eg a line horizontally to the graph from readings of CF 20 and CF 60 to meet the graph and then a vertical line to the Time axis (even if wrongly read scale) or clear marks on the graph and Time axis that correspond to the correct readings or correct values from the Time axis
A1ft: Accept a single value in range 15 to 17 or ft from their cumulative frequency graph provided method is shown eg subtraction of values that would be correct for their graph