
Higher November 2024 Paper 4 Q14
14 The histogram summarises the heights, \(h\) cm, of some plants in a garden centre.
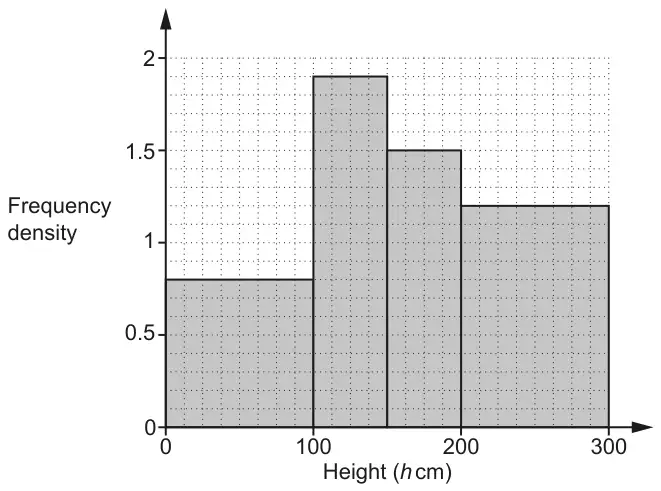
(a) Show that there are 80 plants with a height in the interval \(0 \lt h \leqslant 100\). [1]
(b) The value, in pounds, of each plant depends on the plant’s height.
The table below shows this information.
The table below shows this information.
| Height (\(h\) cm) | Value (£) |
|---|---|
| \(0 \lt h \leqslant 100\) | 2.50 |
| \(100 \lt h \leqslant 150\) | 3.40 |
| \(150 \lt h \leqslant 200\) | 5.00 |
| \(200 \lt h \leqslant 300\) | 6.30 |
Use this information to find the total value of the plants represented in the histogram. [4]
| Answer | Marks | Part marks and guidance | |
|---|---|---|---|
| 0.8 × 100 | 1 | accept \(\frac{8}{10}\) oe fraction for 0.8 | |
| Answer | Marks | Part marks and guidance | |
|---|---|---|---|
| 1 654 | 4 | M3 for 80 × 2.5 + 95 × 3.4 + 75 × 5 + 120 × 6.3 or 200 + 323 + 375 + 756 or M2 for the expression with two errors or B1 for one of 95, 75 and 120 or M1 for 80 × 2.5 + their95 × 3.4 + their75 × 5 + their120 × 6.3 | for M3 condone one error allow M2 for 200 + 646 + 750 + 756 allow M1 for e.g. 200 + 646 + 750 + 1575 |