
Higher June 2025 Paper 4 Q21
21 The graph of a function is drawn on the grid for \(0 \leqslant x \leqslant 4\).
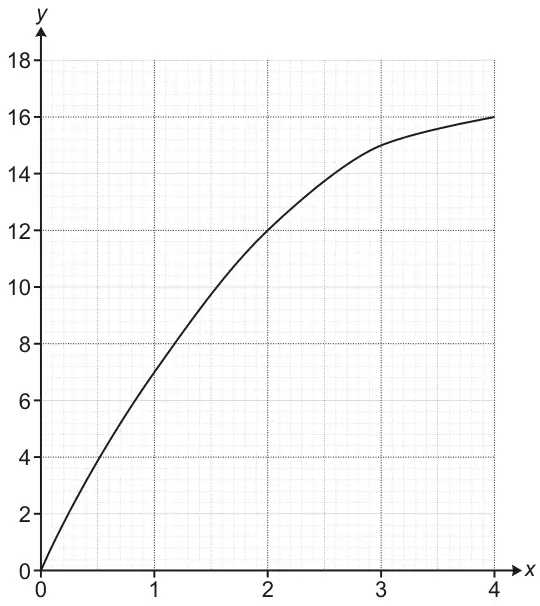
(a) Work out the average rate of change of the function between \(x = 1\) and \(x = 3\). [2]
(b) Use the graph to estimate the gradient of the function at \(x = 2.5\).
You must show working to support your estimate. [4]
You must show working to support your estimate. [4]
| Answer | Marks | Part marks and guidance | |
|---|---|---|---|
| 3.8 – 4.2 nfww | 2 | M1 for \(\dfrac{\textit{their}\,15 - \textit{their}\,7}{3 - 1}\) oe | condone \(6.8 \leqslant\) their\(7 \leqslant 7.2\) and \(14.8 \leqslant\) their\(15 \leqslant 15.2\) e.g \(\frac{14.8 - 7.2}{3 - 1} = 3.8\) This part cannot be answered with a tangent at \(x = 2\). |
| Answer | Marks | Part marks and guidance | |
|---|---|---|---|
| Ruled tangent drawn at \(x = 2.5\) | B1 | Tangent should not cross the curve, should touch at \(x = 2.5\) (condone slight daylight between tangent and curve) and condone running along the curve slightly. Ignore any tangent at \(x = 2\) for this part. | |
| using two points on their tangent at \(x = 2.5\) | M1 | this might be in the form of a triangle or two points clearly identified or in a calculation | The remaining 3 marks depend on a reasonable ruled attempt at a tangent clearly at \(x = 2.5\) so B0 M1 M1 A1FT is possible. |
| use of \(\dfrac{\textit{difference in } y}{\textit{difference in } x}\) | M1 | M1 for attempting to divide vertical distance by horizontal distance on their tangent at \(x = 2.5\) even if the readings are inaccurate | |
| accurate calculation from their tangent | A1FT | The final mark (A1) is easily checked for accuracy by using the ‘ruler’ which is lined up on the tangent and extended as far as possible, calculate the gradient, or translate the ruler to put one end on the origin, and use a tolerance of ± 0.2 and if their figure is within range award A1 | |