
Higher June 2022 Paper 1 Q10
10 The table shows some information about the profit made each day at a cricket club on 100 days.
| Profit (£\(x\)) | Frequency |
|---|---|
| \(0 \leqslant x \lt 50\) | 10 |
| \(50 \leqslant x \lt 100\) | 15 |
| \(100 \leqslant x \lt 150\) | 25 |
| \(150 \leqslant x \lt 200\) | 30 |
| \(200 \leqslant x \lt 250\) | 5 |
| \(250 \leqslant x \lt 300\) | 15 |
(a) Complete the cumulative frequency table.
(1)
| Profit (£\(x\)) | Cumulative frequency |
|---|---|
| \(0 \leqslant x \lt 50\) | |
| \(0 \leqslant x \lt 100\) | |
| \(0 \leqslant x \lt 150\) | |
| \(0 \leqslant x \lt 200\) | |
| \(0 \leqslant x \lt 250\) | |
| \(0 \leqslant x \lt 300\) |
(b) On the grid, draw a cumulative frequency graph for this information.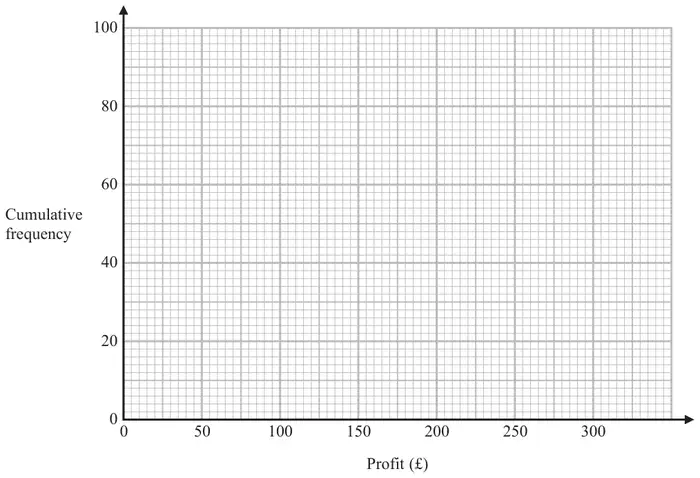
(c) Use your graph to find an estimate for the number of days on which the profit was less than £125 (1)
(d) Use your graph to find an estimate for the interquartile range. (2)
| Answer | Mark | Mark scheme |
|---|---|---|
| 10, 25, 50, 80, 85, 100 | B1 | cao |
| Answer | Mark | Mark scheme |
|---|---|---|
| Graph drawn | M1 | for 5 or 6 of their points plotted correctly from a cf table with no more than one error |
| A1 | for a fully correct graph SC B1 for 5 or 6 cf values plotted at correct heights not at end but consistently within each interval and joined provided no gradient is negative |
Additional guidance
If histograms drawn, plots must be identified.
Accept a smooth curve or line segments.
Ignore to the left of the first point and right of the last point.
| Answer | Mark | Mark scheme |
|---|---|---|
| 35 to 39 | B1 | for answer in the range 35 to 39 or ft their graph (if possible) |
| Answer | Mark | Mark scheme |
|---|---|---|
| 85 to 93 | M1 | for finding the difference between readings taken from the profit axis at points from a cf of 25 and a cf of 75 ft their graph (if possible) |
| A1 | for answer in the range 85 to 93 or ft their graph (if possible) |
Additional guidance
If answer is in the range award the marks unless from obvious incorrect working