
Higher November 2018 Paper 2 Q2
2 Sean has information about the height, in cm, and the weight, in kg, of each of ten rugby players.
He is asked to draw a scatter graph and a line of best fit for this information.
Here is his answer.
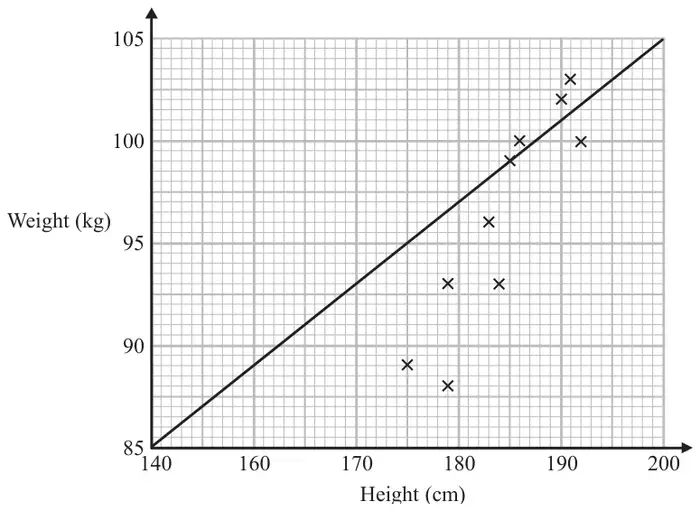
Sean has plotted the points accurately.
Write down two things that are wrong with his answer. (2)
| Answer | Mark | Mark scheme |
|---|---|---|
| statements | C1 | for lobf incorrect Acceptable examples lobf lobf does not suit all points/not a lobf lobf wrong since hits \(x\) axis/is inaccurate/should be amongst the crosses lobf goes through the origin/through one point Not acceptable examples no correlation/there is no title |
| C1 | for height scale not linear Acceptable examples 150 missing Height not linear / Height numbers going up wrong Not acceptable examples 150 graph does not start at 140/graph does not start at 0 height should start at 170 |