
Higher November 2017 Paper 3 Q11
11 The cumulative frequency graph shows information about the weights of 60 potatoes.
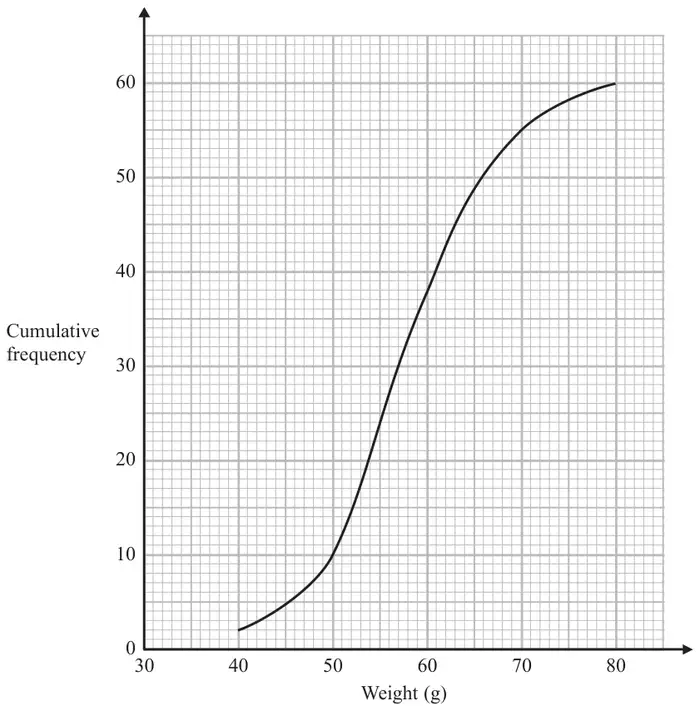
(a) Use the graph to find an estimate for the median weight. (1)
Jamil says,
“\(80 - 40 = 40\) so the range of the weights is 40 g.”
(b) Is Jamil correct?
You must give a reason for your answer. (1)
You must give a reason for your answer. (1)
(c) Show that less than 25% of the potatoes have a weight greater than 65 g. (2)
| Answer | Mark | Notes |
|---|---|---|
| 57 | B1 | cao |
| Answer | Mark | Notes |
|---|---|---|
| Decision and reason | C1 | Jamil might not be correct and reason, eg the maximum weight could be less than 80 or the minimum weight could be less than 40 |
| Answer | Mark | Notes |
|---|---|---|
| Shown | C1 | for evidence of reading from the graph at weight 65 (= 48 to 49) or at cf 45 (= 63) |
| C1 | eg 25% of 60 is 15 but only 11 potatoes have a weight greater than 65 g or 25% of potatoes have a weight greater than 63 g |