
Higher November 2017 Paper 2 Q11
11 The pie charts give information about the ages, in years, of people living in two towns, Adley and Bridford.
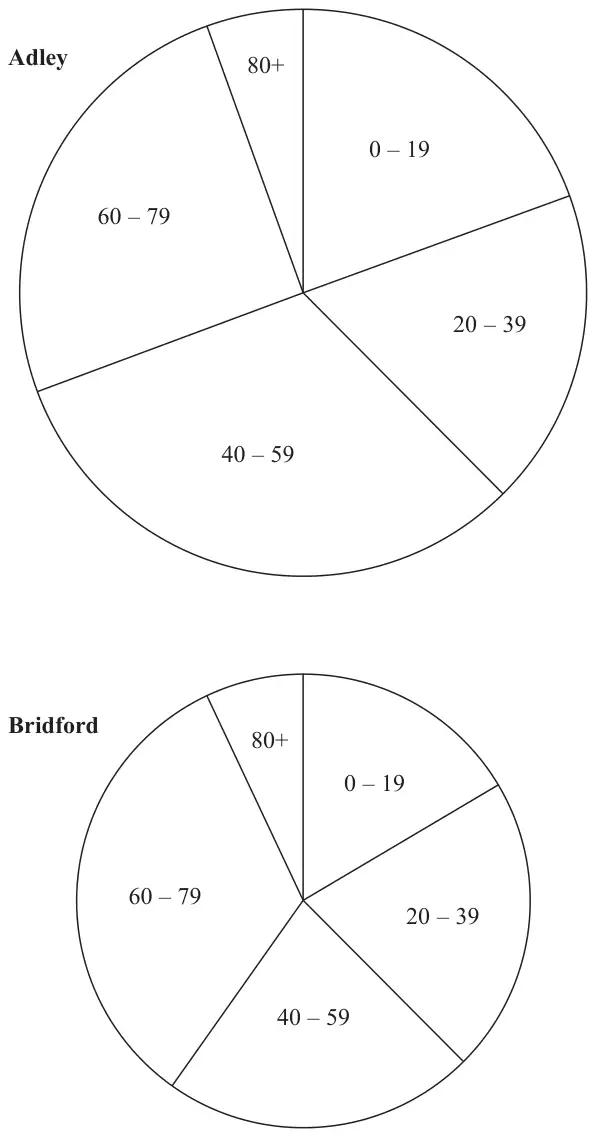
Diagrams accurately drawn
The ratio of the number of people living in Adley to the number of people living in Bridford is given by the ratio of the areas of the pie charts.
What proportion of the total number of people living in these two towns live in Adley and are aged 0 – 19?
Give your answer correct to 3 significant figures. (3)
| Answer | Mark | Notes |
|---|---|---|
| 0.119 | P1 | for starting the process, eg finds area \(25\pi\) or \(16\pi\) oe, or finds angle for town A, 0 – 19 \((70^\circ)\), may be on diagram |
| P1 | for a complete process, eg \(\dfrac{70}{360} \times \dfrac{25\pi}{41\pi}\) | |
| A1 | 0.118 – 0.119 or 11.8% - 11.9% |