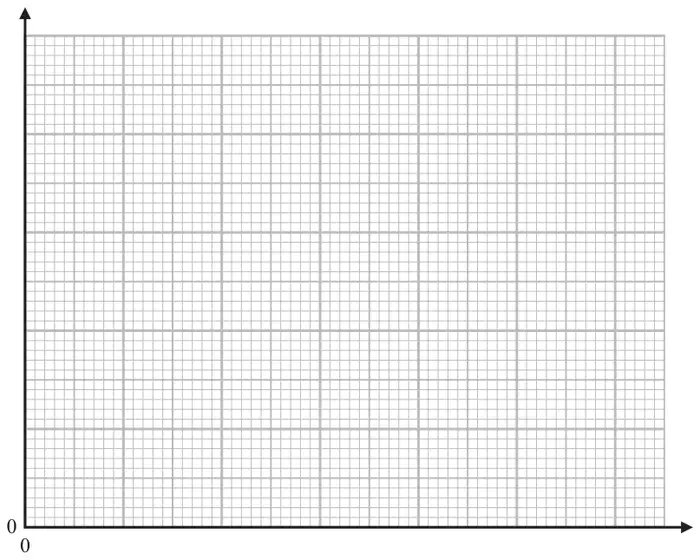
13 The table gives information about the amount of time that each of 150 people were in a shop.
Time (\(t\) minutes)
Frequency
\(0 \lt t \leqslant 10\)
20
\(10 \lt t \leqslant 30\)
70
\(30 \lt t \leqslant 35\)
22
\(35 \lt t \leqslant 50\)
30
\(50 \lt t \leqslant 60\)
8
(a) On the grid, draw a histogram for this information.(3)
(b) Work out an estimate for the fraction of these 150 people who were in the shop for between 20 minutes and 40 minutes. (2)
Mark scheme (a)
Answer
Mark
Mark scheme
Histogram drawn
B3
for fully correct histogram with axes scaled and labelled
(B2
for 4 correct bars or for frequency \(\div\) class width for all 5 frequencies and 2 correct bars of different widths)
(B1
for 2 correct bars of different widths or for frequency \(\div\) class width for at least 3 frequencies)
Additional guidance
Relative heights 2, 3.5, 4.4, 2, 0.8
Mark scheme (b)
Answer
Mark
Mark scheme
\(\dfrac{67}{150}\)
M1
for a method to find number of people in interval eg \(\dfrac{1}{2} \times 70 + 22 + \dfrac{1}{3} \times 30\ (= 67)\) or \(150 - 20 - 8 - \dfrac{1}{2} \times 70 - \dfrac{2}{3} \times 30\ (= 67)\) or \(10 \times [3.5] + 5 \times [4.4] + 5 \times [2]\) ft their histogram
A1
for \(\dfrac{67}{150}\) or ft their histogram
Additional guidance
Where [3.5], [4.4] and [2] are the heights of the bars of their histogram