
Higher November 2022 Paper 2 Q11
11 In an experiment, 60 students each completed a puzzle.
The cumulative frequency graph shows information about the times taken for the 60 students to complete the puzzle.
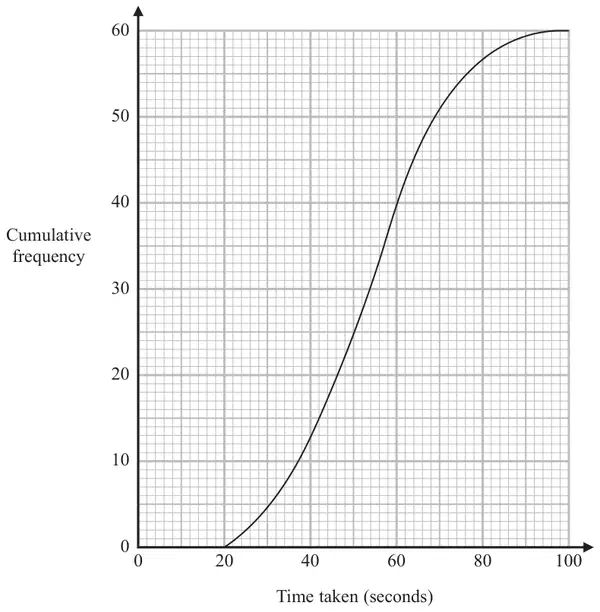
For these 60 students,
the least time taken was 24 seconds
the greatest time taken was 96 seconds.
On the grid below, draw a box plot for the distribution of the times taken by the students.
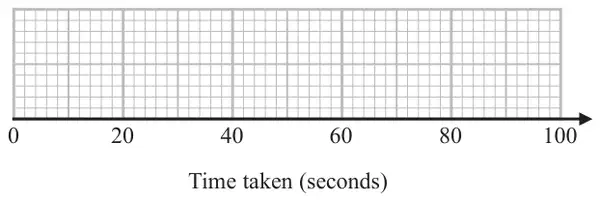
(3)
| Answer | Mark | Mark scheme |
|---|---|---|
| Box plot | B3 | for fully correct box plot |
| (B2 | for box plot showing a box and at least 3 correctly plotted values from 24, 42, 54, 64, 96) | |
| (B1 | for correctly identifying one of the LQ (42) Median (54) or UQ (64) from the CF graph) |
Additional guidance
Box can be of any height. Accept ends that are marked (eg line, cross, dot) or defined by the end of the whiskers if clear
May be implied by one of these correct on the box plot