
Higher November 2022 Paper 1 Q14
14 The table shows information about the weights, in grams, of some potatoes.
| Weight (\(w\) grams) | Number of potatoes |
|---|---|
| \(50 \lt w \leqslant 70\) | 20 |
| \(70 \lt w \leqslant 80\) | 50 |
| \(80 \lt w \leqslant 90\) | 60 |
| \(90 \lt w \leqslant 110\) | 30 |
On the grid, draw a histogram for this information.
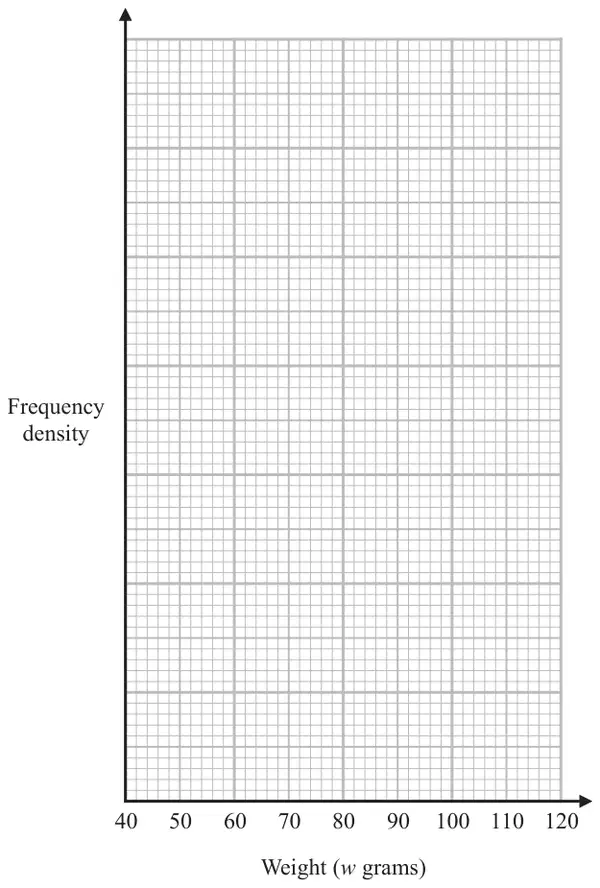
(3)
| Answer | Mark | Mark scheme |
|---|---|---|
| Histogram drawn | B3 | for fully correct histogram, eg relative heights 1, 5, 6, 1.5 |
| (B2 | for 3 correct bars or for frequency ÷ class interval for at least 3 frequencies and 2 correct bars of different widths) | |
| (B1 | for 2 correct bars of different widths or for frequency ÷ class interval for at least 3 frequencies) |
Additional guidance
Frequency densities are 1, 5, 6, 1.5