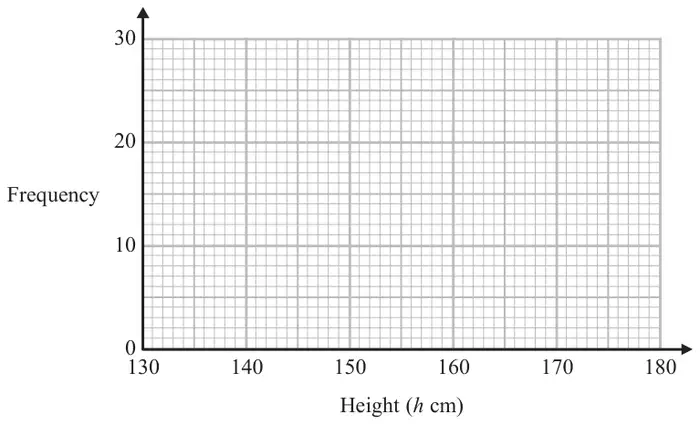
19 The table shows information about the heights of 80 children.
Height (\(h\) cm)
Frequency
\(130 \lt h \leqslant 140\)
4
\(140 \lt h \leqslant 150\)
11
\(150 \lt h \leqslant 160\)
24
\(160 \lt h \leqslant 170\)
22
\(170 \lt h \leqslant 180\)
19
(a) Find the class interval that contains the median. (1)
(b) Draw a frequency polygon for the information in the table.(2)
Mark scheme (a)
Answer
Mark
Notes
\(160 \lt h \leqslant 170\)
B1
correct class interval
Mark scheme (b)
Answer
Mark
Notes
Line segments joining the points (135, 4), (145, 11), (155, 24), (165, 22) and (175, 19)
C2
for fully correct frequency polygon
[C1
for points plotted correctly at midpoints of intervals OR joining points with line segments at the correct heights and consistent within the intervals (including end values) OR correct frequency polygon with one point incorrect OR correct frequency polygon with first and last point joined] NB: ignore any histogram drawn and any part of frequency polygon outside range of first and last points plotted