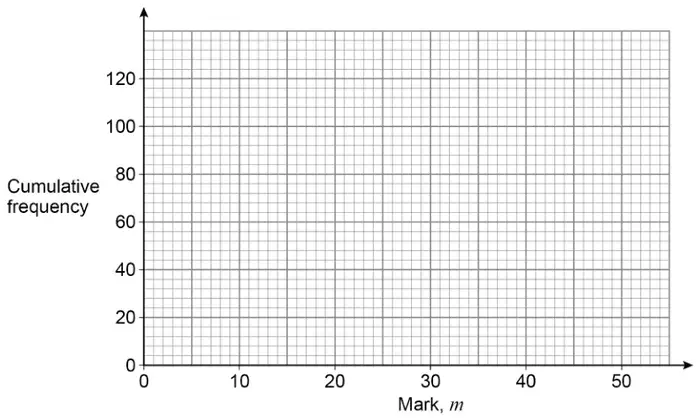
15 Here is some information about the test marks of 120 students.
Mark, \(m\)
\(0 < m \leqslant 10\)
\(10 < m \leqslant 20\)
\(20 < m \leqslant 30\)
\(30 < m \leqslant 40\)
\(40 < m \leqslant 50\)
Frequency
20
28
40
20
12
(a) Complete the cumulative frequency table. [1 mark]
Mark, \(m\)
\(m \leqslant 10\)
\(m \leqslant 20\)
\(m \leqslant 30\)
\(m \leqslant 40\)
\(m \leqslant 50\)
Cumulative frequency
20
48
(b) Draw a cumulative frequency graph. [2 marks]
(c) Students who scored 15 marks or fewer take another test.
Use your graph to estimate how many students take another test. [2 marks]
Mark scheme (a)
Answer
Mark
Comments
(20 48) 88 108 120
B1
Mark scheme (b)
Answer
Mark
Comments
All 5 points plotted using upper class bounds and their cf values
M1
\(\pm \dfrac{1}{2}\) small square must be increasing
Smooth curve or polygon for their cf values
A1ft
\(\pm \dfrac{1}{2}\) small square must be increasing
Additional guidance
If (a) is correct, points should be at (10, 20), (20, 48), (30, 88), (40, 108) and (50, 120)
For A1, the graph should start at (0, 0) or (1, 0) or (10, 20)
For A1, the graph should end at \(m = 50\) unless it followed by a horizontal line adjoining (50, 120)
Histogram only
M0A0
Histogram and graph
Mark curve
Mark scheme (c)
Answer
Mark
Comments
Line from 15 marks to their graph
M1
\(\pm \dfrac{1}{2}\) small square implied by mark at correct place on the graph or on the vertical axis (but not on the horizontal axis) or by correct reading from their graph
Correct reading from their graph for 15 marks
A1ft
\(\pm \dfrac{1}{2}\) small square
Additional guidance
Correct reading for their graph, with or without evidence of using graph
M1A1
No graph in (b)
M0A0
For M1 and A1ft the domain of their graph must be at least \(10 \leqslant m \leqslant 20\) and their graph must be increasing in the domain \(10 \leqslant m \leqslant 50\) or from \(m = 10\) if their graph does not extend to \(m = 50\)