
Higher November 2020 Paper 2 Q17
17 The cumulative frequency graph shows information about the masses of 200 apples.
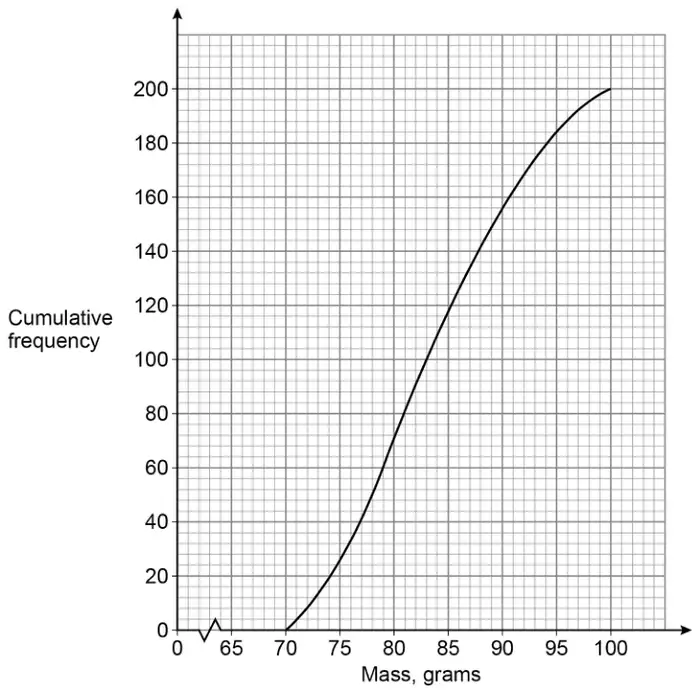
(a) Estimate the median mass. [1 mark]
(b) Apples with mass 90 grams or less cost 32p each.
Apples with mass more than 90 grams cost 39p each.
Estimate the total cost of the 200 apples. [3 marks]
| Answer | Mark | Comments |
|---|---|---|
| [82.5, 83.5] | B1 |
| Answer | Mark | Comments |
|---|---|---|
| 156 | B1 | accept 155 or 157 |
| their \(156 \times (0.)32\) or 4992 or 49.92 and \((200 -\) their \(156) \times (0.)39\) or \(44 \times (0.)39\) or 1716 or 17.16 | M1 | \(0 <\) their \(156 < 200\) but their 156 cannot be 90 6708 implies B1M1 |
| 67.08 | A1ft | ft their 156 |
Additional guidance
| 155 \(155 \times 0.32 + 45 \times 0.39\) \(= 49.60 + 17.55\) \(= 67.15\) | B1 M1 A1 |
| 157 \(157 \times 0.32 + 43 \times 0.39\) \(= 50.24 + 16.77\) \(= 67.01\) | B1 M1 A1 |
| 158 \(158 \times 0.32 + 42 \times 0.39\) \(= 50.56 + 16.38\) \(= 66.94\) | B0 M1 A1ft |
| 90 \(90 \times 0.32 + 110 \times 0.39\) \(= 28.80 + 42.90\) \(= 71.70\) | B0 M0 A0 |