
Higher November 2017 Paper 2 Q24
24 Beth ran a 200 metre race.
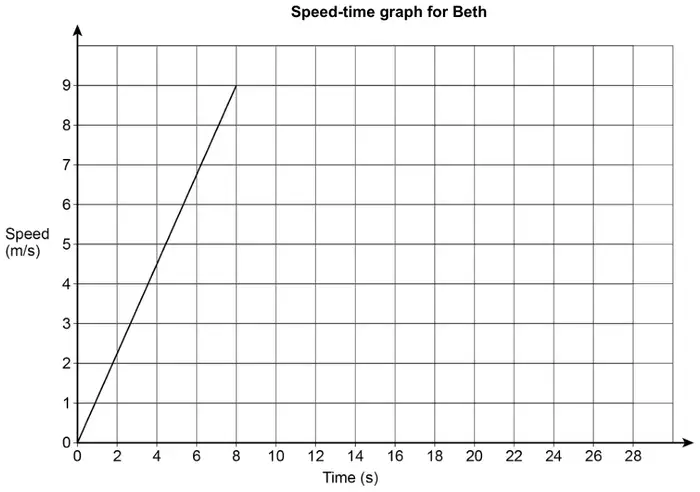
Here is a graph of the first 8 seconds of her race.
She completed the race at a constant speed of 9 m/s
Amy completed the race in 27 seconds.
Did Beth finish before Amy?
You must show your working. [3 marks]
| Answer | Mark | Comments |
|---|---|---|
| Alternative method 1 | ||
| \(0.5 \times 8 \times 9\) or 36 or \((27 - 8) \times 9\) or \(19 \times 9\) or 171 | M1 | May be seen on graph |
| \(0.5 \times 8 \times 9 + (27 - 8) \times 9\) or 207 | M1dep | M2 \(0.5 \times (27 + 19) \times 9\) |
| 207 and Yes | A1 | |
| Alternative method 2 | ||
| \(0.5 \times 8 \times 9\) or 36 | M1 | May be seen on graph |
| \(\dfrac{200 - \text{their } 36}{9}\) or \(\dfrac{164}{9}\) or 18.2… | M1dep | |
| 26.2… and Yes or 18.2… and 19 and Yes | A1 | |
| Alternative method 3 | ||
| \(0.5 \times 8 \times 9\) or 36 | M1 | May be seen on graph |
| \(\dfrac{200 - \text{their } 36}{27 - 8}\) or \(\dfrac{164}{19}\) or 8.6… | M1dep | |
| 8.6… and Yes | A1 | |
| Alternative method 4 | ||
| \(0.5 \times 8 \times 9\) or 36 | M1 | May be seen on graph |
| Attempt at total distance for Beth for \(26.\dot{2} \leqslant\) total time \(\lt 27\) | M1dep | eg (time 26.5s) \(0.5 \times 8 \times 9 + (26.5 - 8) \times 9\) |
| Correct total distance for Beth for \(26.\dot{2} \leqslant\) total time \(\lt 27\) and Yes | A1 | eg (time 26.5s) 202.5 and Yes |