
Higher November 2017 Paper 1 Q16
16 Water is poured into a tank.
The graph shows the number of litres of water in the tank.
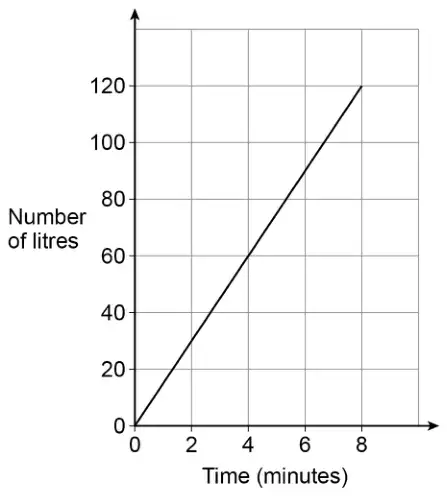
How much water is poured into the tank each minute?
Circle your answer. [1 mark]
- 1.5 litres
- 15 litres
- 30 litres
- 120 litres
| Answer | Mark | Comments |
|---|---|---|
| 15 litres | B1 |