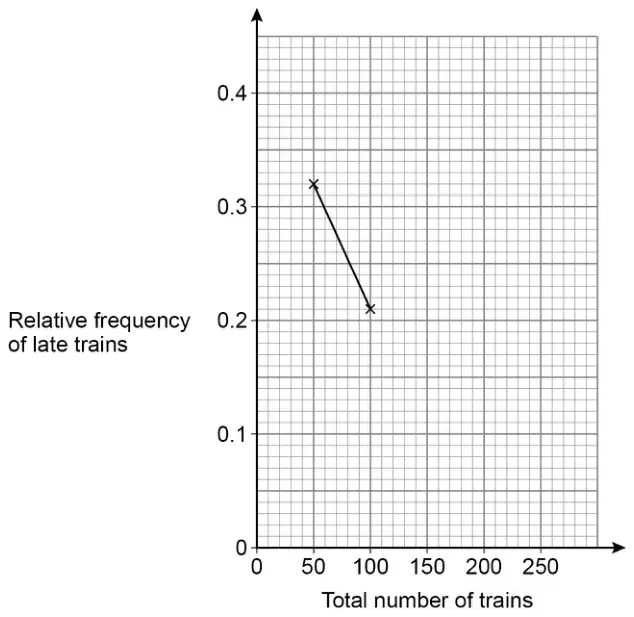
The number of trains that were late was recorded after every 50 trains.
The table shows some information about the results.
Total number of trains
50
100
150
200
250
Total number of late trains
16
21
36
38
55
Relative frequency of late trains
0.32
0.21
(a) Complete the relative frequency graph. [3 marks]
(b) Write down the best estimate of the probability that a train arriving at the station is late. [1 mark]
Mark scheme (a)
Answer
Mark
Comments
Any one of 0.24 or 0.19 or 0.22 in the correct cell
M1
oe fraction, decimal or percentage eg \(\dfrac{36}{150}\) or \(\dfrac{38}{200}\) or \(\dfrac{55}{250}\) implied by any correct point for these three values
At least two of their relative frequencies plotted accurately
M1dep
\(\pm\dfrac{1}{2}\) square
(150, 0.24), (200, 0.19) and (250, 0.22) plotted and graph completed with straight lines
A1
\(\pm\dfrac{1}{2}\) square allow dotted or solid lines
Additional guidance
Mark intention for straightness of lines
Ignore any continuation of line after the last point or any other lines drawn on the graph, for example a line of best fit
Mark scheme (b)
Answer
Mark
Comments
0.22
B1ft
oe fraction, decimal or percentage eg \(\dfrac{55}{250}\) ft their relative frequency for 250 trains (\(\gt 0\) and \(\lt 1\)) given in table or plotted on graph
Additional guidance
The mark may be awarded for a correct restart or a follow through from their table or a follow through from their graph
Ignore attempts to convert a correct relative frequency once seen in (b)
NB \(\dfrac{166}{750}\) = 0.2213… is incorrect (unless it is given as their relative frequency for 250 trains)